Land × score
X axis = land price per m² (US$, log). Y axis = indicative score. Dividers = medians of the chart sample. Points marked “(est.)” use an estimated price per m²; the method is on each city page and in the methodology.
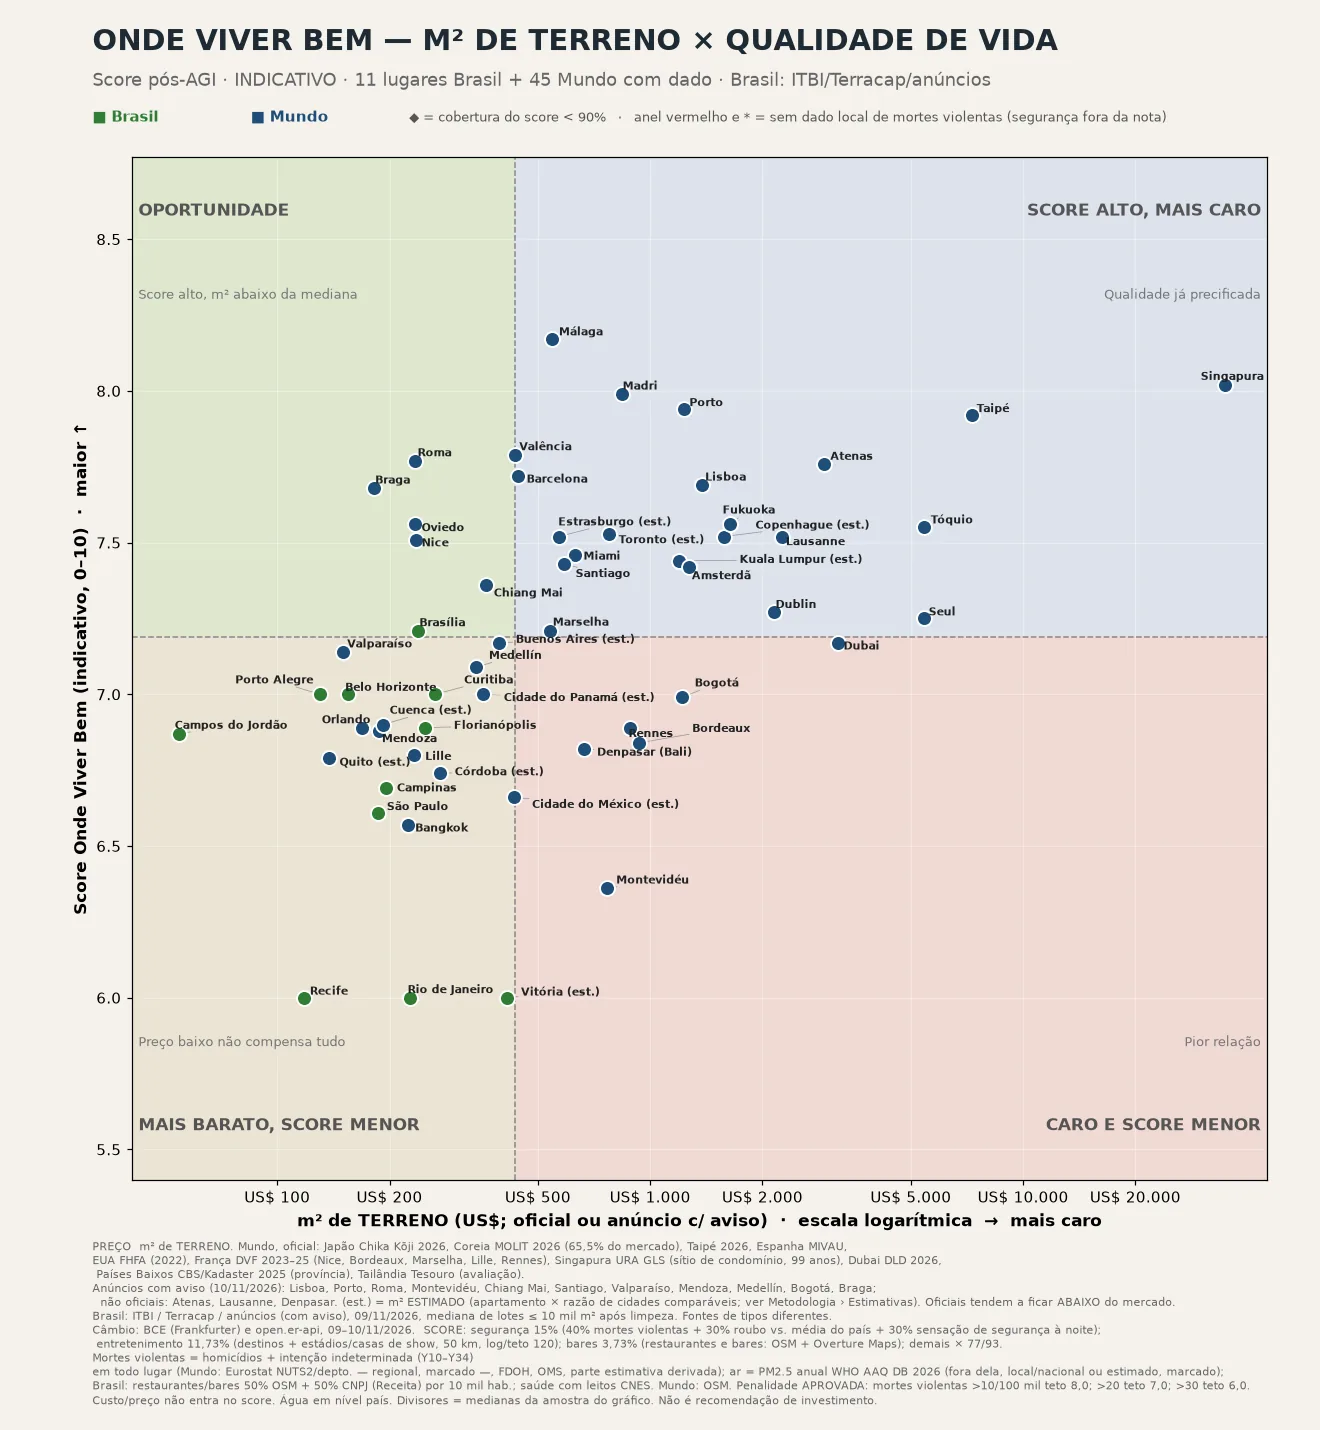
Sources in the image footer: listings / official indices, exchange rate 9–10 Nov 2026. Different source types on the same axis.