Onde Viver Bem

World · Netherlands

Amsterdam

indicative score regional figure

7.42 / 10

Technical notes for this page

Updated November 10, 2026. Indicative score. Weights: entertainment 11.73% (destinations and venues within 50 km); bars 3.73%; safety 15% with a penalty; water at country level; land price per m² = official source (ITBI, Terracap, registries, valuations) or listings with a caveat · coverage 100%

Amsterdam has an indicative score of 7.42/10 in the World ranking of Onde Viver Bem, updated November 10, 2026. The strongest published variables are Airport (10.00), Culture (10.00) and Entertainment (10.00); the weakest are Sun (1.26), Mild climate (3.13) and Safety (5.71). The scores are indicative. Cost of living and the land price per m² are not part of the score.
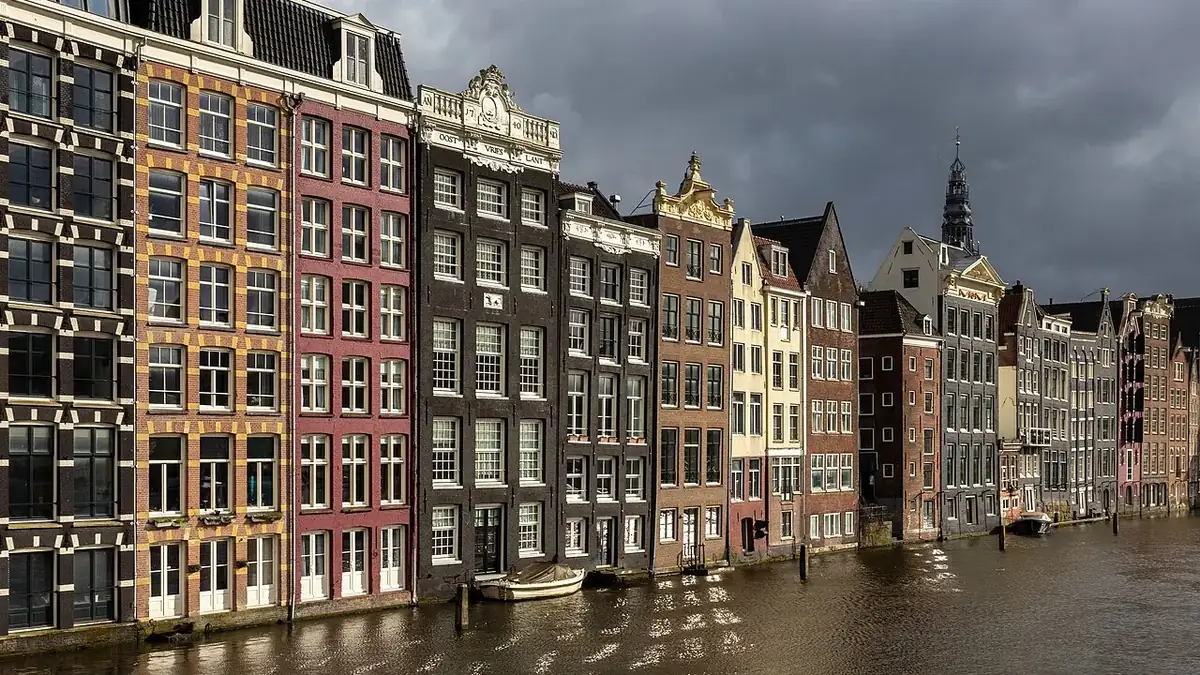
Amsterdam: view of the city
Amsterdam. Photo: Basile Morin, CC BY-SA 4.0, Wikimedia Commons.
safety: regional, not municipal, figure (Eurostat NUTS2)

Land price per m²

US$ 1,272/m² (EUR 1,136)

CBS/Kadaster — average price per m² of new-home plots, Noord-Holland, 2025 · source

Collected November 10, 2026 · exchange rate EUR 0.89342 per US$ (Frankfurter API (ECB reference rates), 2026-11-09)

Note: Province figure (Noord-Holland), not the municipality of Amsterdam; average (not median), preliminary, including VAT. In Amsterdam almost all land is municipal and held in erfpacht (ground lease), so the city's value tends to be higher.

Score breakdown

Each criterion's score, its weight in the total and the raw figure, linked to its source.

Safety · score 5.71 · weight 15.00% · sources: homicidios_100k_local (1.11) · obitos_indeterminados_100k (0.31) · roubo_razao_cidade_pais (3.91) · sensacao_seguranca_noite_pct (77.0)
raw: 1.11 per 100k pop. · 40% violent deaths (log 30→0, 0.5→10 per 100k) + 30% city robbery ÷ country average (log 5×→0, 0.5×→10) + 30% share who feel safe at night (lin 30%→0, 95%→10); any part without data: weights renormalized
Composite safety: violent deaths 1.1 per 100k → 8.1 (weight 40%) · robbery 3.91× the country average (gemeente Amsterdam, 2024) → 1.1 (weight 30%) · 77.0% feel safe walking alone at night (Amsterdam (greater city) NL001C, 2023) → 7.2 (weight 30%).
Beach / mountains · score 10.00 · weight 11.59% · sources: km_ate_praia_osm (5.0) · km_ate_relevo_montanhoso (>150) · osm_cachoeiras_50km (7.0) · osm_areas_protegidas_50km (757.0) · osm_trilhas_rota_50km (1789.0) · osm_mirantes_50km (440.0)
raw: 5.0 km · beach: distance log 5 km→10, 150 km→0; mountains: richness of nature leisure (mean of the top 3 of 4 counts, 50 km) × access (1 up to 15 km → 0 at 150 km, log), 0 with no relief; score = min(10, max(beach, mountains) + 0.3·min)
Water · score 8.89 · weight 9.94% · sources: wb_estresse_hidrico_pais (16.659) · wb_agua_gerida_segura_pais (99.96)
raw: 16.659 % withdrawal / available resources · average: stress log 100%→0, 10%→10; safe water lin 50%→0, 100%→10
Parks · score 7.29 · weight 9.94% · sources: osm_parques_2km (51.0) · osm_parques_municipio (274.0)
raw: 51.0 count of OSM objects · 50% log1p(count within 2 km), 60→10 + 50% log1p(per 10k pop.), 15→10
Sun · score 1.26 · weight 9.94% · sources: radiacao_solar_global (1138.7)
raw: 1138.7 kWh/m²/year · lin 1000→0, 2100→10 kWh/m²/year
Restaurants · score 9.20 · weight 9.11% · sources: osm_restaurantes_2km (1200.0) · osm_restaurantes_municipio (1996.0) · overture_restaurantes_2km (2341.0) · overture_restaurantes_municipio (4324.0)
raw: Average of two mapping sources, OpenStreetMap and Overture Maps (Overture count ÷ K, K = median Overture/OSM ratio across the 39 cities: 2.57 within 2 km, 3.41 in the municipality); each source: 50% log1p(count within 2 km), 1000→10 + 50% log1p(per 10k pop.), 30→10. Brazil: 50% of that score + 50% log1p(CNPJ per 10k pop. ÷ K), 30→10
Entertainment · score 10.00 · weight 11.73% · sources: osm_destinos_entretenimento_50km (244.0) · osm_arenas_grandes_50km (32.0)
raw: 276.0 count of OSM objects (destinations + venues, 50 km) · log1p(destinations + stadiums/music venues), 120→10; 50 km radius
A1ed, radius 50 km: 244.0 destinations (theme_park/zoo/aquarium/water_park) + 32.0 stadiums/music venues (stadium, music_venue, concert_hall). Left out: events_venue, sports_centre, theatre, amusement_ride, amusement_arcade. OpenStreetMap via ohsome.
Bars · score 8.26 · weight 3.73% · sources: osm_bares_2km (449.0) · osm_bares_municipio (600.0) · overture_bares_2km (597.0) · overture_bares_municipio (936.0)
raw: Average of two mapping sources, OpenStreetMap and Overture Maps (Overture count ÷ K, K = median Overture/OSM ratio across the 39 cities: 2.48 within 2 km, 3.20 in the municipality); each source: 50% log1p(count within 2 km), 500→10 + 50% log1p(per 10k pop.), 10→10. Brazil: 50% of that score + 50% log1p(CNPJ per 10k pop. ÷ K), 10→10
Mild climate · score 3.13 · weight 4.97% · sources: dias_conforto_termico (103.3)
raw: 103.3 days/year · lin 0→0, 330→10 days/year
Health · score 6.78 · weight 4.97% · sources: wb_expectativa_vida (81.966) · osm_hospitais_10km (8.0)
raw: 81.966 years · average: life expectancy lin 70→0, 85→10; Brazil: beds/10k pop. lin 0→0, 50→10; World: OSM hospitals within 10 km log1p 50→10
Clean air · score 8.70 · weight 4.14% · sources: pm25_media_anual (8.886)
raw: 8.886 µg/m³ · lin 35→0, 5→10 µg/m³ (WHO=5)
Airport · score 10.00 · weight 2.48% · sources: osm_aeroportos_iata_50km (2.0)
raw: 2.0 count of OSM objects · 0→0, 1→7, ≥2→10
Culture · score 10.00 · weight 2.48% · sources: osm_cultura_5km (225.0)
raw: 225.0 count of OSM objects · log1p(count), 150→10

The city

Amsterdam is the capital and most populous city of the Kingdom of the Netherlands. Its status as the Dutch capital is set by the Constitution of the Netherlands, although it is not the seat of the Dutch government, which is in The Hague. In September 2023 Amsterdam had 930,205 inhabitants in the city proper, 1,470,595 in its urban area and 2,480,394 in the metropolitan area. The city is in the province of North Holland, in the west of the country. It forms much of the northern part of the Randstad, one of Europe's largest urban agglomerations, with about 7 million people.

English rendering of the Portuguese Wikipedia summary linked below. Source: wikipedia_pt. Wikipedia revision 73273940 (2026-10-23T14:05:38Z).

Taxation

Overdrachtsbelasting (transfer tax): 2% (main own home); 8% (other homes: second home, rental); 10.4% (other property); exemption for buyers aged 18–34 up to the annual cap. Base: price/market value. Belastingdienst

annual property tax (IBI/taxe foncière/ENFIA/IMU/固定資産税 etc.); no official local rate collected yet (we do not invent the figure). not collected in this round

Frequently asked questions

What is the Onde Viver Bem score for Amsterdam?

Amsterdam has an indicative score of 7.42/10 in the World ranking, updated November 10, 2026. Cost of living is not part of the score.

What are the strengths and weaknesses of the score for Amsterdam?

The strongest published variables are Airport (10.00), Culture (10.00) and Entertainment (10.00); the weakest are Sun (1.26), Mild climate (3.13) and Safety (5.71).

Does cost of living or the land price per m² enter the score?

No. Cost of living and the land price per m² appear on the page but are not part of the score. See the methodology.

How is the score calculated?

It is an indicative 0–10 quality-of-life index, with 13 variables and published weights. Safety has a 15% weight and, when local data exist, a lethal-violence penalty may cap the total. The full method is on the methodology page.

Are any figures on this page estimates?

This page has no value marked as an estimate. Each metric cites its source.

Cities with a nearby score

Informational content and indicative scores. This is not advice on investing, immigration, buying property or choosing a career. Every metric cites its source; cost of living is not part of the score.