Updated November 18, 2026. Indicative score. Weights: entertainment 11.73% (destinations and venues, rings up to 100 km); bars 3.73%; safety 15% with a penalty; water at country level; land price per m² = official source (ITBI, Terracap, registries, valuations) or listings with a caveat · coverage 100%
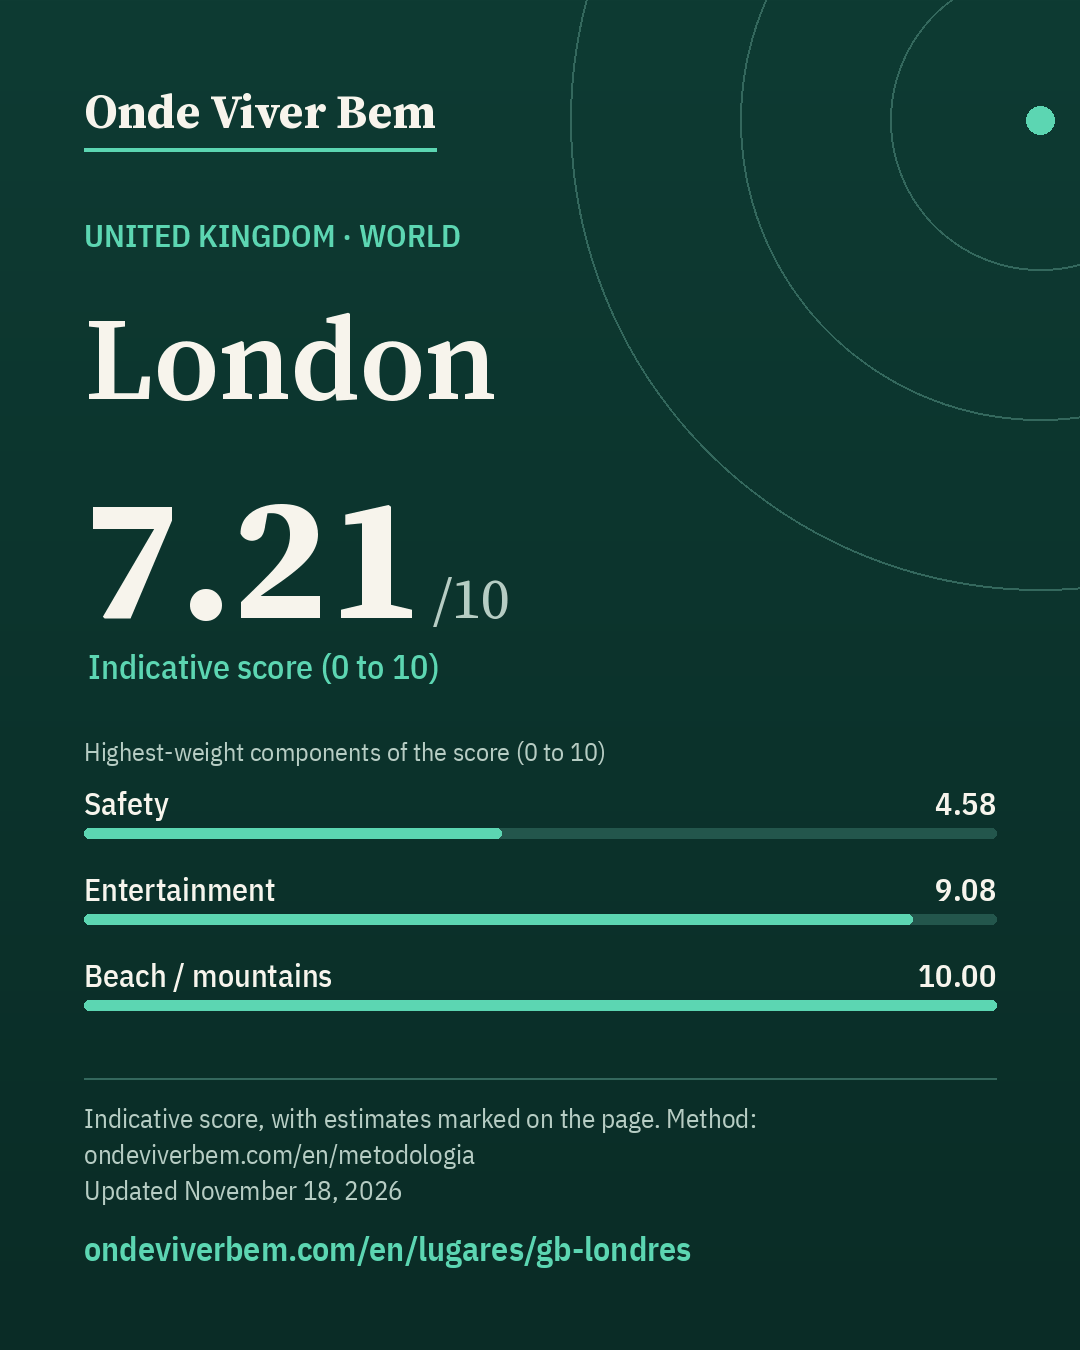
London has an indicative score of 7.21/10 in the World ranking of Onde Viver Bem, updated November 18, 2026. The strongest published variables are Airport (10.00), Beach / mountains (10.00) and Culture (9.84); the weakest are Sun (0.87), Mild climate (3.08) and Safety (4.58). The scores are indicative. Cost of living is not part of the score. The published land price per m² is US$ 2,966/m² (estimated); that price is not part of the score. Some figures on this page are estimates and carry the “estimated” badge.
safety: undetermined-intent deaths from the WHO MDB United Kingdom 2023 (national), not 2024 (series break); estimated: air (PM2.5 CAMS 2024; official/WHO 2019, outside the 5-year window); estimated: land price per m² (asking price on Rightmove, n=12)
Land price per m²
US$ 2,966/m²estimated – low confidenceestimated (GBP 2,244) · sensitivity range US$ 949–US$ 5,368 · n=12 · small sample
unofficial asking prices in listings, not transactions · Rightmove, London region, n=12 · source · latest observation November 15, 2026
Collected November 15, 2026 · exchange rate GBP 0.756391 per US$ (open.er-api.com, 15 Nov 2026)
Note: ESTIMATE: asking price of residential land in the London region on Rightmove on 15 Nov 2026, up to 1,000 m², excluding auctions, Green Belt, existing buildings and commercial use: n=12, median £2,244/m² (US$ 2,966); P25–P75 range £718–4,060 (P75/P25 = 5.7). It replaces the indexed hypothetical official MHCLG 2023 appraisal (US$3,194), kept as a cross-check (−7%). Asking prices, not sale prices. Differences between British cities are low-precision. Low confidence. The range is a sensitivity range, not a confidence interval.
Score breakdown
Each criterion's score, its weight in the total and the raw figure, linked to its source.
raw: 2.17 per 100k pop. · 40% violent deaths (log 30→0, 0.5→10 per 100k) + 30% city robbery ÷ country average (log 5×→0, 0.5×→10) + 30% share who feel safe at night (lin 30%→0, 95%→10); any part without data: weights renormalized
Composite safety: violent deaths 2.2 per 100k → 6.4 (weight 40%) · robbery 2.93× the country average (Greater London / London Region, ) → 2.3 (weight 30%) · 58.5% feel safe walking alone at night (London UK001C, 2023) → 4.4 (weight 30%).
raw: 5.0 km · beach: log distance 5 km→10, 150 km→0, searched up to 100 km since 2026-11-12 (before, up to 60 km); mountains: richness of nature leisure (mean of the top 3 of 4 counts, 50 km) × access (1 up to 15 km → 0 at 150 km, log), 0 without relief; score = min(10, max(beach, mountain) + 0.3·min)
100 km radius (2026-11-12): beach within 5 km (includes lake/river) → beach 10.00; mountains 0.00; score 10.00 (before 10.00).
raw: 95.0 count of OSM objects · 50% log1p(count within 2 km), 60→10 + 50% log1p(per 10k pop.), 15→10 · since 2026-11-12: 60% this local score + 40% a regional score up to 100 km (rings 0–30/30–60/60–100 km weighted 1/0.5/0.2; count and density per inhabitant; METODOLOGIA §25)
100 km radius (2026-11-12): 3,961 parks at 0–30 km, 2,836 at 30–60 km and 4,833 at 60–100 km (OSM, ohsome 2026-07-27); weighted 1/0.5/0.2 = 6,346 = 6,346; weighted population 14,920,343 (GHS-POP 2025) → 4.25 per 10k people. Regional score 8.50. Local score 7.74 (weight 60%) and regional 8.50 (weight 40%) → 8.04.
raw: 1467.0 count of OSM objects · Average of two mapping sources, OpenStreetMap and Overture Maps (Overture count ÷ K, K = median Overture/OSM ratio across the 39 cities: 2.57 within 2 km, 3.41 in the municipality); each source: 50% log1p(count within 2 km), 1000→10 + 50% log1p(per 10k pop.), 30→10. Brazil: 50% of that score + 50% log1p(CNPJ per 10k pop. ÷ K), 30→10 · since 2026-11-12: 60% this local score + 40% a regional score up to 100 km (rings 0–30/30–60/60–100 km weighted 1/0.5/0.2; count and density per inhabitant; METODOLOGIA §25)
100 km radius (2026-11-12): 9,756 restaurants at 0–30 km, 2,580 at 30–60 km and 3,099 at 60–100 km (OSM, ohsome 2026-07-27); weighted 1/0.5/0.2 = 11,663 × OSM completeness factor 0.97 (Overture in the municipality) = 11,348; weighted population 14,920,343 (GHS-POP 2025) → 7.61 per 10k people. Regional score 8.39. Local score 8.44 (weight 60%) and regional 8.39 (weight 40%) → 8.42.
raw: 243.0 destinations + venues weighted by distance (rings up to 100 km) · 50% log1p(weighted count), 110→10 + 50% log1p(per million people in the region, GHSL), 32.0→10; rings 0–30/30–60/60–100 km weighted 1/0.5/0.2 (since 2026-11-12; before: count within 50 km, 120→10)
100 km radius (2026-11-12): 163 destinations and venues at 0–30 km, 108 at 30–60 km and 130 at 60–100 km (OSM, ohsome 2026-07-27); weighted 1/0.5/0.2 = 243 = 243; weighted population 14,920,343 (GHS-POP 2025) → 16.29 per million people. Regional score 9.08.
raw: 614.0 count of OSM objects · Average of two mapping sources, OpenStreetMap and Overture Maps (Overture count ÷ K, K = median Overture/OSM ratio across the 39 cities: 2.48 within 2 km, 3.20 in the municipality); each source: 50% log1p(count within 2 km), 500→10 + 50% log1p(per 10k pop.), 10→10. Brazil: 50% of that score + 50% log1p(CNPJ per 10k pop. ÷ K), 10→10 · since 2026-11-12: 60% this local score + 40% a regional score up to 100 km (rings 0–30/30–60/60–100 km weighted 1/0.5/0.2; count and density per inhabitant; METODOLOGIA §25)
100 km radius (2026-11-12): 4,966 bars at 0–30 km, 2,932 at 30–60 km and 4,162 at 60–100 km (OSM, ohsome 2026-07-27); weighted 1/0.5/0.2 = 7,265 × OSM completeness factor 0.82 (Overture in the municipality) = 5,929; weighted population 14,920,343 (GHS-POP 2025) → 3.97 per 10k people. Regional score 8.13. Local score 8.30 (weight 60%) and regional 8.13 (weight 40%) → 8.23.
raw: 81.3868536585366 years · average: life expectancy lin 70→0, 85→10; Brazil: beds/10k pop. lin 0→0, 50→10; World: OSM hospitals within 10 km log1p 50→10
Clean airestimated · score 8.34 · weight 4.14%
Estimate: ESTIMATE (not a measurement): the most recent official WHO reading for London is 2019 (11.205 µg/m³), outside the methodology's 5-year window. We use the 2024 CAMS mean at the city centre (9.99 µg/m³), marked as an estimate.
raw: 350.0 count of OSM objects · log1p(count), 150→10 · since 2026-11-12: 60% this local score + 40% a regional score up to 100 km (rings 0–30/30–60/60–100 km weighted 1/0.5/0.2; count and density per inhabitant; METODOLOGIA §25)
100 km radius (2026-11-12): 849 cultural venues at 0–30 km, 351 at 30–60 km and 596 at 60–100 km (OSM, ohsome 2026-07-27); weighted 1/0.5/0.2 = 1,144 = 1,144; weighted population 14,920,343 (GHS-POP 2025) → 7.67 per 100k people. Regional score 9.59. Local score 10.00 (weight 60%) and regional 9.59 (weight 40%) → 9.84.
The city
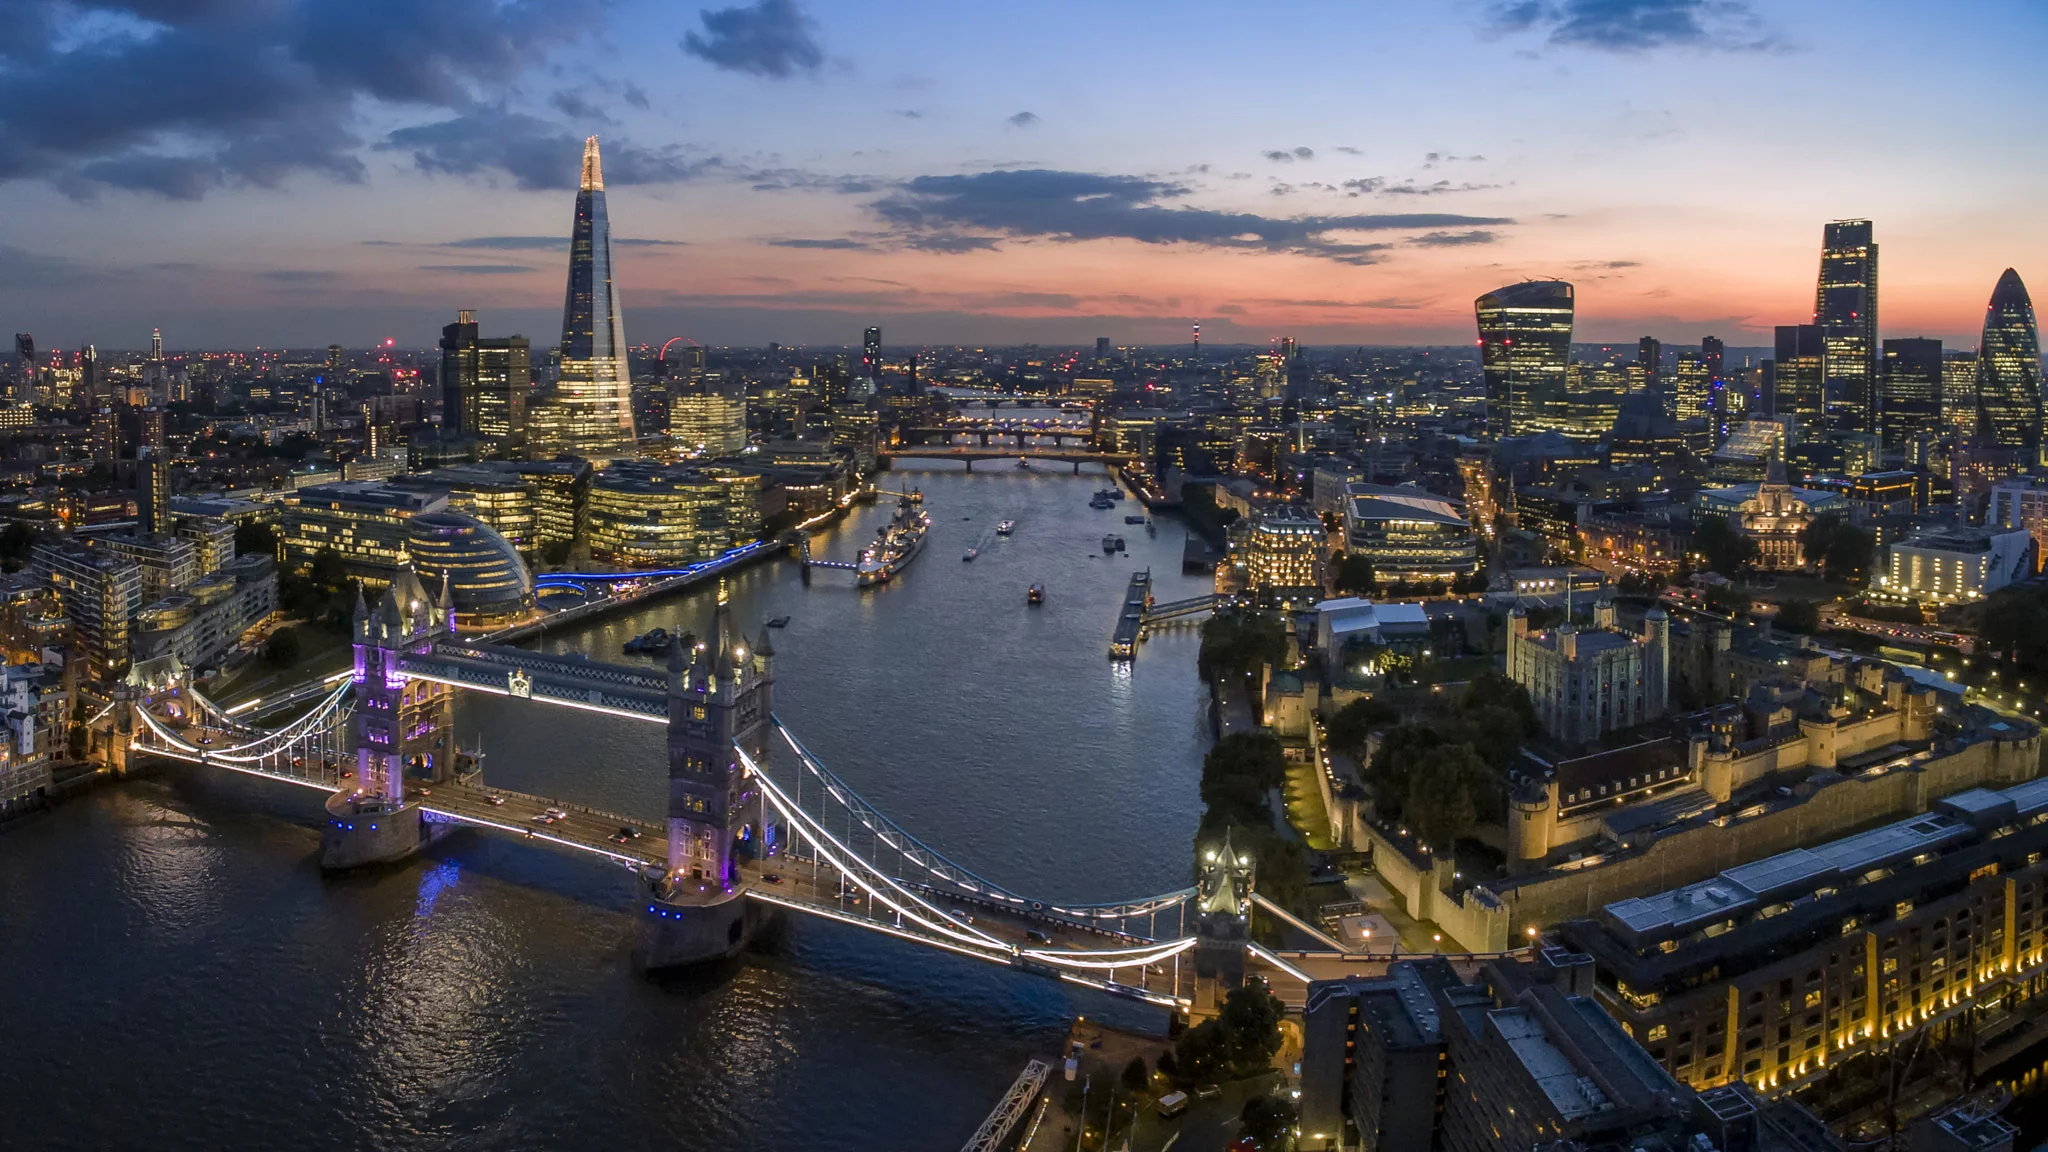
London is the capital and largest city of England and the United Kingdom, with a population of 9.14 million people in 2025. Its wider metropolitan area is the largest in Western Europe, with a population of 15.4 million. London stands on the River Thames in southeast England, at the head of a 50-mile (80 km) tidal estuary down to the North Sea, and has been a major settlement for nearly 2,000 years. Its ancient core and financial centre, the City of London, was founded by the Romans as Londinium and has retained its medieval boundaries. The City of Westminster, to the west of the City of London, has been the site of the national government and parliament for centuries. London grew rapidly in the 19th century, becoming the world's largest city at the time. Since the 19th century the name \"London\" has referred to the metropolis around the City of London, historically split among the counties of Middlesex, Essex, Surrey, Kent and Hertfordshire. Since 1965 it has largely comprised the administrative area of Greater London, governed by 33 local authorities and the Greater London Authority.
English rendering of the Portuguese Wikipedia summary linked below. Source: wikipedia_pt. Wikipedia revision 73266190 (2026-10-22T02:48:56Z).
Taxation
transfer / property tax; no official local rate collected yet (we do not invent the figure). Tax table to be checked in the country's/city's official source.
Frequently asked questions
What is the Onde Viver Bem score for London?
London has an indicative score of 7.21/10 in the World ranking, updated November 18, 2026. Cost of living is not part of the score.
What are the strengths and weaknesses of the score for London?
The strongest published variables are Airport (10.00), Beach / mountains (10.00) and Culture (9.84); the weakest are Sun (0.87), Mild climate (3.08) and Safety (4.58).
Does cost of living or the land price per m² enter the score?
No. Cost of living and the land price per m² appear on the page but are not part of the score. See the methodology.
How is the score calculated?
It is an indicative 0–10 quality-of-life index, with 13 variables and published weights. Safety has a 15% weight and, when local data exist, a lethal-violence penalty may cap the total. The full method is on the methodology page.
Are any figures on this page estimates?
Yes. Some values are documented estimates, labelled with the “estimated” badge in the technical notes. The method is explained in the Estimates section.
Download the image and post it to your feed, story or video. To send people to the site, use the link sticker in your story or the link in your bio (links in captions are not clickable).
Informational content and indicative scores. This is not advice on investing, immigration, buying property or choosing a career. Every metric cites its source; cost of living is not part of the score.