Updated November 18, 2026. Indicative score. Weights: entertainment 11.73% (destinations and venues, rings up to 100 km); bars 3.73%; safety 15% with a penalty; water at country level; land price per m² = official source (ITBI, Terracap, registries, valuations) or listings with a caveat · coverage 100%
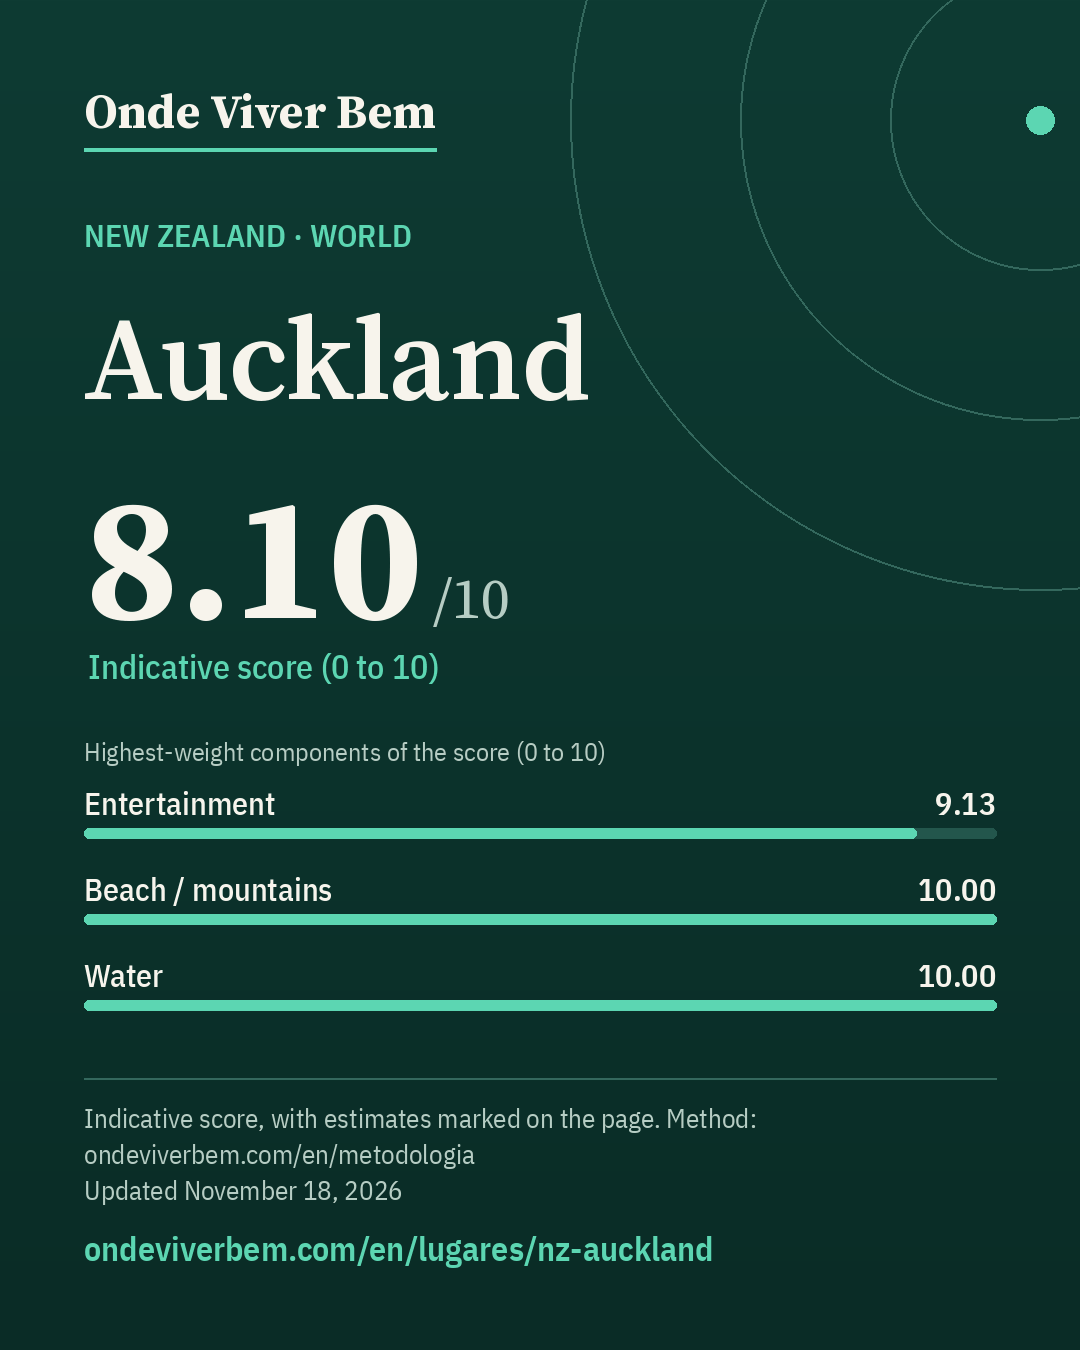
Auckland has an indicative score of 8.10/10 in the World ranking of Onde Viver Bem, updated November 18, 2026. The strongest published variables are Airport (10.00), Water (10.00) and Beach / mountains (10.00); the weakest are Bars (5.45), Sun (5.60) and Mild climate (5.68). The scores are indicative. Cost of living is not part of the score. The published land price per m² is US$ 1,101/m² (estimated); that price is not part of the score. Some figures on this page are estimates and carry the “estimated” badge.
safety: incomplete definition (no undetermined-intent deaths); safety: feeling of safety at national level only (Gallup); estimated: homicide (national rate as a proxy for the city); estimated: robbery (median of comparable cities); estimated: land price per m² (apartment × ratio of comparable cities)
unofficial ESTIMATE: apartment (Numbeo) × land/apartment ratio of comparable cities · source · latest observation November 10, 2026
Note: ESTIMATE (not a measurement; UNOFFICIAL base): no land price collected. Land m² = apartment m² outside the centre (Numbeo, $5,410.38) × median land÷apartment ratio in 28 published cities outside Brazil with a measured land price (0.204) = US$ 1,101/m² (range US$ 850–2,653). Ratios: Mendoza 0.167, Lausanne 0.161, Santiago 0.228, Valparaíso 0.145, Bogotá 0.550, Medellín 0.180, Barcelona 0.087, Madrid 0.181, Málaga 0.170, Valencia 0.133, Nice 0.053, Athens 0.878, Denpasar (Bali) 0.880, Dublin 0.365, Rome 0.072, Fukuoka 0.626, Tokyo 0.975, Seoul 0.471, Amsterdam 0.187, Lisbon 0.291, Porto 0.314, Singapore 2.079, Bangkok 0.070, Chiang Mai 0.220, Taipei 1.046, Miami 0.164, Orlando 0.064, Montevideo 0.372. Low confidence; queued for direct measurement (2025/26 listings or transactions).
Score breakdown
Each criterion's score, its weight in the total and the raw figure, linked to its source.
Safetyestimated · score 5.85 · weight 15.00%
Estimate: ESTIMATE (not a measurement): no local robbery statistic found. City÷country ratio = median of the 59 cities with measured robbery outside Brazil (1.80×). P10–P90 range 1.02–2.97× (deliberately wide: large cities range from 0.4× to 5× the national average). Cap 2.97× (the city holds 34% of the country's population; the ratio cannot exceed 1 ÷ that share). Base: Oviedo 0.38, Sydney 0.61, Braga 0.67, Fukuoka 0.91, Las Palmas de Gran Canaria 0.92, Lima 0.92, Seoul 1.05, Malaga 1.06, Perth 1.13, Brisbane 1.20, Melbourne 1.22, San Diego 1.23, Nice 1.26, Taipei 1.34, Austin 1.34, Busan 1.35, Valparaíso 1.41, Vancouver 1.45, Palma de Mallorca 1.46, Montreal 1.49, Miami 1.58, Rome 1.63, Medellín 1.66, Strasbourg 1.67, Alicante 1.70, Santiago 1.70, George Town 1.71, Tokyo 1.76, Madrid 1.80, Panama City 1.80, Bilbao 1.84, Kuala Lumpur 1.85, Orlando 1.90, Mexico City 1.93, Toronto 1.94, Valencia 2.03, Cape Town 2.04, Osaka 2.07, Dublin 2.10, Montevideo 2.13, Athens 2.16, Seville 2.16, Buenos Aires 2.27, Copenhagen 2.50, Berlin 2.70, Rennes 2.71, Bogotá 2.75, Mendoza 3.16, Córdoba 3.31, Amsterdam 3.91, Marseille 3.98, Tel Aviv 4.10, Porto 4.50, Lisbon 4.50, Lille 4.52, Lausanne 4.65, Bordeaux 4.89, Barcelona 5.58, San José 7.32.
raw: 1.46 per 100k pop. · 40% violent deaths (log 30→0, 0.5→10 per 100k) + 30% city robbery ÷ country average (log 5×→0, 0.5×→10) + 30% share who feel safe at night (lin 30%→0, 95%→10); any part without data: weights renormalized
Composite safety: violent deaths 1.5 per 100k → 7.4 (weight 40%) · ESTIMATED robbery 1.80× the country average (median of comparable cities; range 1.02–2.97×) → 4.4 (weight 30%) estimated · 64.0% feel safe walking alone at night (New Zealand (national), 2024) → 5.2 (weight 30%).
raw: 5.0 km · beach: log distance 5 km→10, 150 km→0, searched up to 100 km since 2026-11-12 (before, up to 60 km); mountains: richness of nature leisure (mean of the top 3 of 4 counts, 50 km) × access (1 up to 15 km → 0 at 150 km, log), 0 without relief; score = min(10, max(beach, mountain) + 0.3·min)
100 km radius (2026-11-12): beach within 5 km → beach 10.00; mountains 0.00; score 10.00 (before 10.00).
raw: 63.0 count of OSM objects · 50% log1p(count within 2 km), 60→10 + 50% log1p(per 10k pop.), 15→10 · since 2026-11-12: 60% this local score + 40% a regional score up to 100 km (rings 0–30/30–60/60–100 km weighted 1/0.5/0.2; count and density per inhabitant; METODOLOGIA §25)
100 km radius (2026-11-12): 2,926 parks at 0–30 km, 434 at 30–60 km and 256 at 60–100 km (OSM, ohsome 2026-07-27); weighted 1/0.5/0.2 = 3,194 = 3,194; weighted population 1,875,905 (GHS-POP 2025) → 17.03 per 10k people. Regional score 9.74. Local score 10.00 (weight 60%) and regional 9.74 (weight 40%) → 9.89.
raw: Average of two mapping sources, OpenStreetMap and Overture Maps (Overture count ÷ K, K = median Overture/OSM ratio across the 39 cities: 2.57 within 2 km, 3.41 in the municipality); each source: 50% log1p(count within 2 km), 1000→10 + 50% log1p(per 10k pop.), 30→10. Brazil: 50% of that score + 50% log1p(CNPJ per 10k pop. ÷ K), 30→10 · since 2026-11-12: 60% this local score + 40% a regional score up to 100 km (rings 0–30/30–60/60–100 km weighted 1/0.5/0.2; count and density per inhabitant; METODOLOGIA §25)
100 km radius (2026-11-12): 1,916 restaurants at 0–30 km, 71 at 30–60 km and 54 at 60–100 km (OSM, ohsome 2026-07-27); weighted 1/0.5/0.2 = 1,962 × OSM completeness factor 0.75 (Overture in the municipality) = 1,472; weighted population 1,875,905 (GHS-POP 2025) → 7.84 per 10k people. Regional score 7.39. Local score 7.48 (weight 60%) and regional 7.39 (weight 40%) → 7.44.
raw: 54.4 destinations + venues weighted by distance (rings up to 100 km) · 50% log1p(weighted count), 110→10 + 50% log1p(per million people in the region, GHSL), 32.0→10; rings 0–30/30–60/60–100 km weighted 1/0.5/0.2 (since 2026-11-12; before: count within 50 km, 120→10)
100 km radius (2026-11-12): 51 destinations and venues at 0–30 km, 6 at 30–60 km and 2 at 60–100 km (OSM, ohsome 2026-07-27); weighted 1/0.5/0.2 = 54 = 54; weighted population 1,875,905 (GHS-POP 2025) → 29.00 per million people. Regional score 9.13.
raw: Average of two mapping sources, OpenStreetMap and Overture Maps (Overture count ÷ K, K = median Overture/OSM ratio across the 39 cities: 2.48 within 2 km, 3.20 in the municipality); each source: 50% log1p(count within 2 km), 500→10 + 50% log1p(per 10k pop.), 10→10. Brazil: 50% of that score + 50% log1p(CNPJ per 10k pop. ÷ K), 10→10 · since 2026-11-12: 60% this local score + 40% a regional score up to 100 km (rings 0–30/30–60/60–100 km weighted 1/0.5/0.2; count and density per inhabitant; METODOLOGIA §25)
100 km radius (2026-11-12): 329 bars at 0–30 km, 24 at 30–60 km and 28 at 60–100 km (OSM, ohsome 2026-07-27); weighted 1/0.5/0.2 = 347 × OSM completeness factor 0.78 (Overture in the municipality) = 270; weighted population 1,875,905 (GHS-POP 2025) → 1.44 per 10k people. Regional score 5.05. Local score 5.72 (weight 60%) and regional 5.05 (weight 40%) → 5.45.
raw: 59.0 count of OSM objects · log1p(count), 150→10 · since 2026-11-12: 60% this local score + 40% a regional score up to 100 km (rings 0–30/30–60/60–100 km weighted 1/0.5/0.2; count and density per inhabitant; METODOLOGIA §25)
100 km radius (2026-11-12): 131 cultural venues at 0–30 km, 12 at 30–60 km and 13 at 60–100 km (OSM, ohsome 2026-07-27); weighted 1/0.5/0.2 = 140 = 140; weighted population 1,875,905 (GHS-POP 2025) → 7.44 per 100k people. Regional score 8.72. Local score 8.16 (weight 60%) and regional 8.72 (weight 40%) → 8.38.
The city
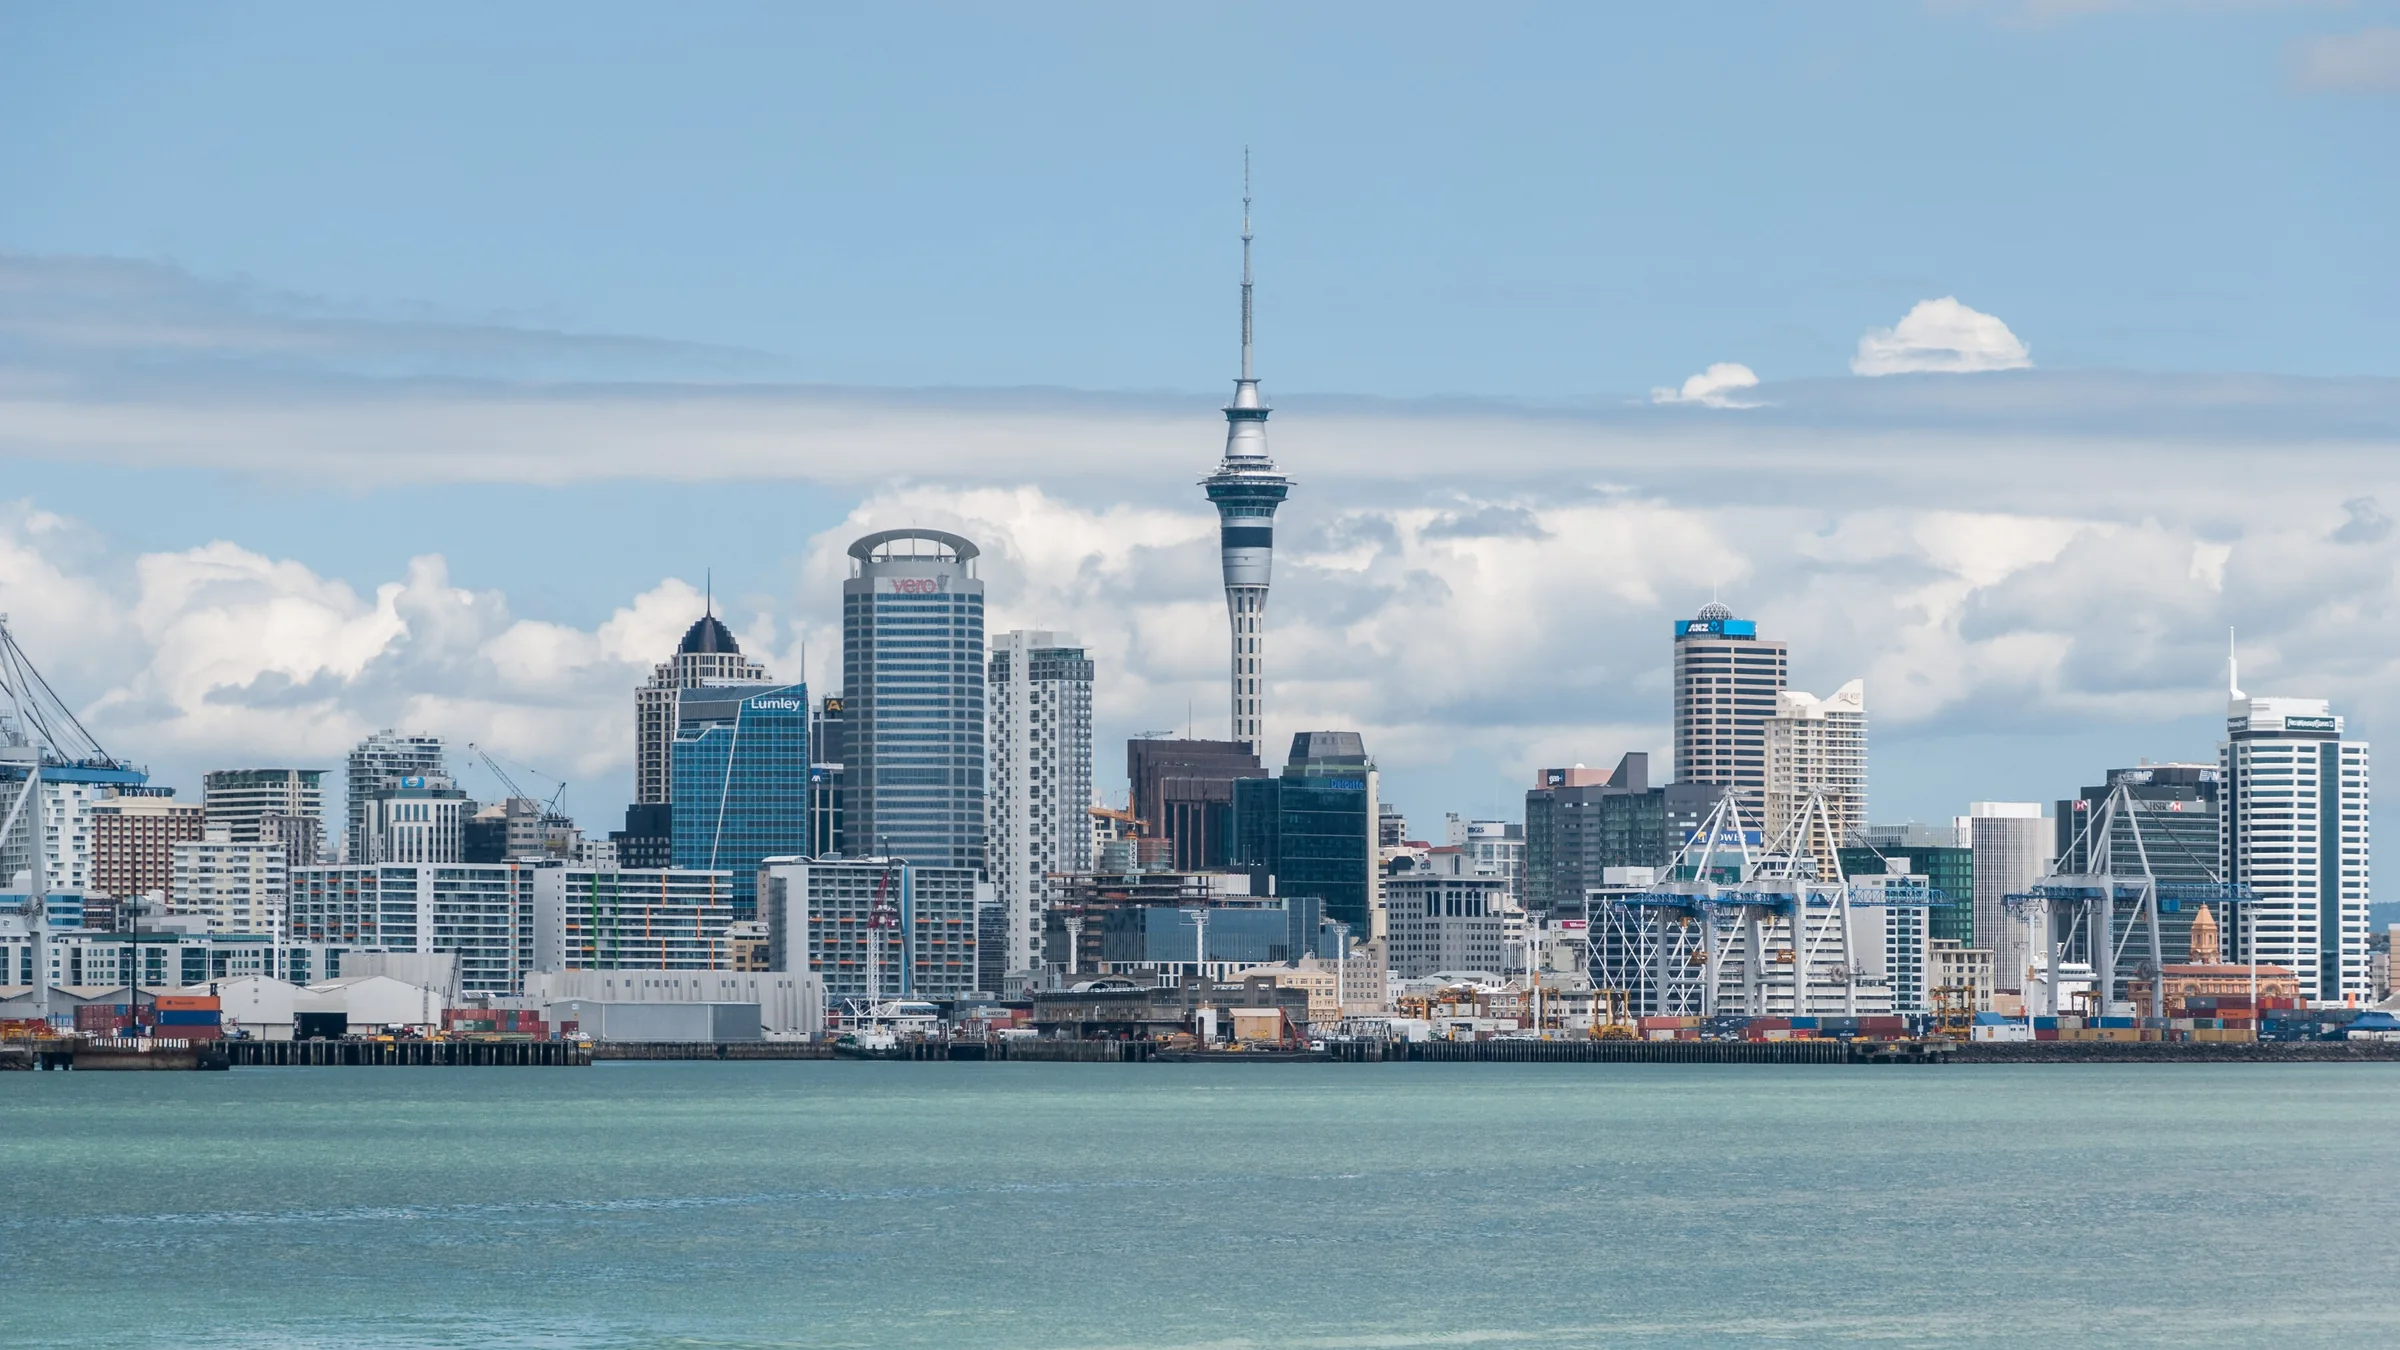
Auckland is the largest city in New Zealand. Although Wellington is the capital, Auckland is New Zealand's main financial and economic centre. With an estimated population of 1,413,700, Auckland is home to about 31% of the country's population. It was founded in 1840 and was the capital of New Zealand until 1865.
English rendering of the Portuguese Wikipedia summary linked below. Source: wikipedia_pt. Wikipedia revision 72172171 (2026-05-02T19:04:38Z).
Frequently asked questions
What is the Onde Viver Bem score for Auckland?
Auckland has an indicative score of 8.10/10 in the World ranking, updated November 18, 2026. Cost of living is not part of the score.
What are the strengths and weaknesses of the score for Auckland?
The strongest published variables are Airport (10.00), Water (10.00) and Beach / mountains (10.00); the weakest are Bars (5.45), Sun (5.60) and Mild climate (5.68).
Does cost of living or the land price per m² enter the score?
No. Cost of living and the land price per m² appear on the page but are not part of the score. See the methodology.
How is the score calculated?
It is an indicative 0–10 quality-of-life index, with 13 variables and published weights. Safety has a 15% weight and, when local data exist, a lethal-violence penalty may cap the total. The full method is on the methodology page.
Are any figures on this page estimates?
Yes. Some values are documented estimates, labelled with the “estimated” badge in the technical notes. The method is explained in the Estimates section.
Download the image and post it to your feed, story or video. To send people to the site, use the link sticker in your story or the link in your bio (links in captions are not clickable).
Informational content and indicative scores. This is not advice on investing, immigration, buying property or choosing a career. Every metric cites its source; cost of living is not part of the score.