Updated November 18, 2026. Indicative score. Weights: entertainment 11.73% (destinations and venues, rings up to 100 km); bars 3.73%; safety 15% with a penalty; water at country level; land price per m² = official source (ITBI, Terracap, registries, valuations) or listings with a caveat · coverage 100%
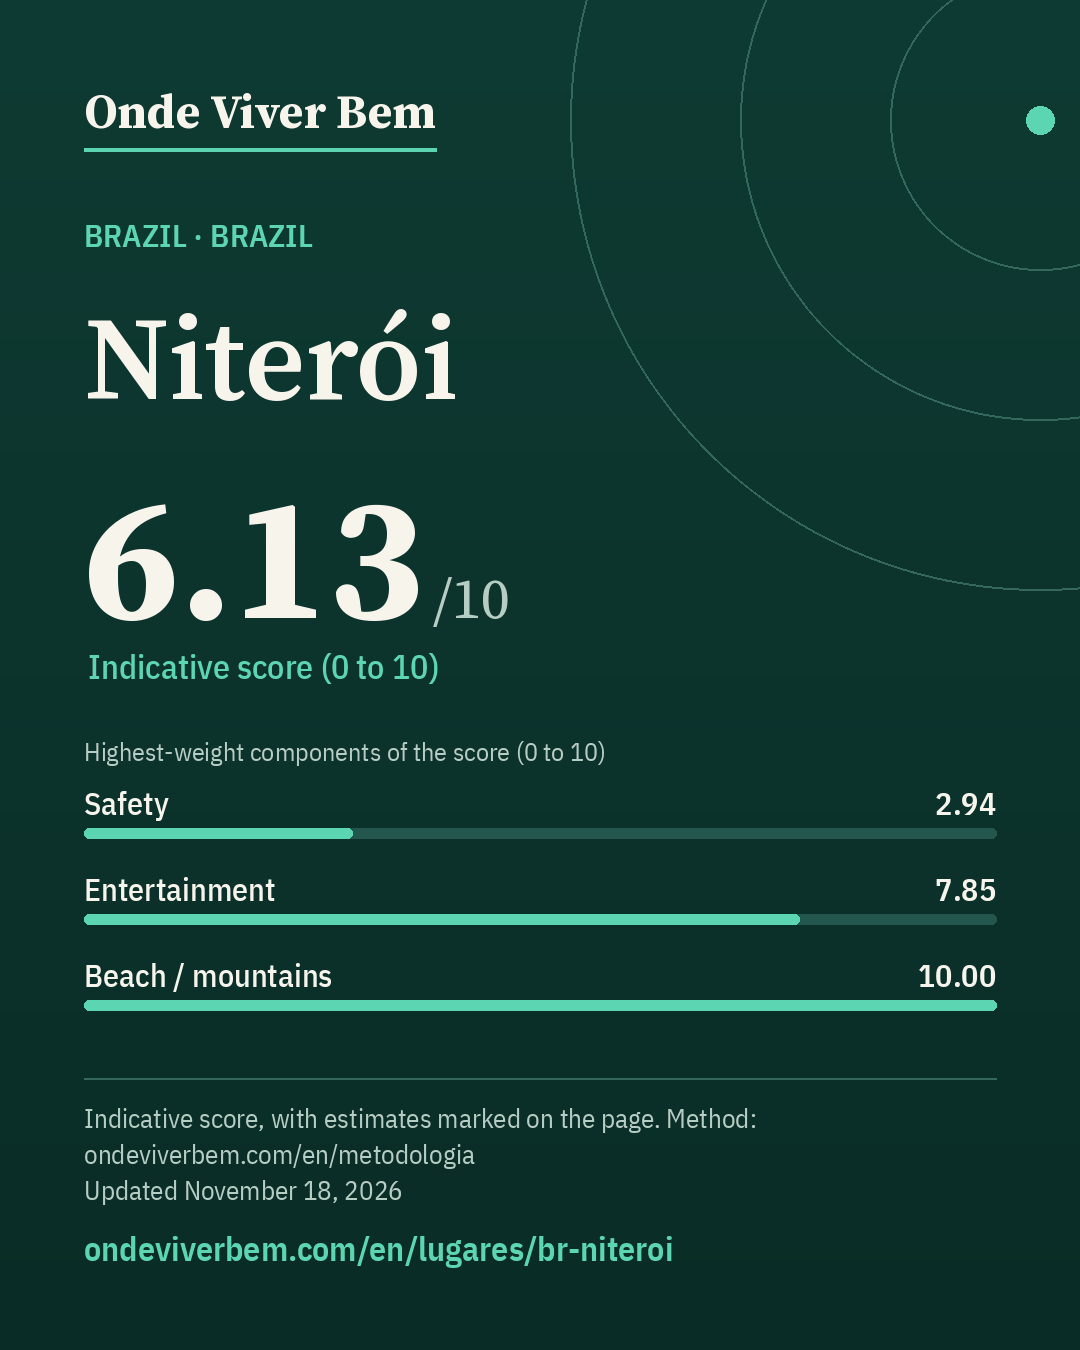
Niterói has an indicative score of 6.13/10 in the Brazil ranking of Onde Viver Bem, updated November 18, 2026. The strongest published variables are Airport (10.00), Beach / mountains (10.00) and Water (8.86); the weakest are Safety (2.94), Bars (4.85) and Restaurants (5.37). The scores are indicative. Cost of living is not part of the score. The published land price per m² is R$ 524/m² (listing); that price is not part of the score. Some figures on this page are estimates and carry the “estimated” badge.
safety: feeling of safety at national level only (Gallup); estimated: air (PM2.5 without a station in the WHO database); safety penalty: score capped at 6.13 (rate 36.5/100k; 6.96 without the penalty)
Land price per m²
R$ 524/m²listingP25–P75 R$ 314–R$ 808 · n=196
unofficial plot listings (asking price) — no open ITBI data; listings with a caveat
Note: Asking price in a listing (not a transaction), ZAP Imóveis, 2026-11-11. Check: median of the medians of 11 neighbourhoods with 3+ listings = R$ 546.18/m², close to the published value. The sample is concentrated where lots are for sale (Engenho do Mato, Serra Grande, Itaipu, Várzea das Moças: 63% of listings, Região Oceânica and Pendotiba); it does not represent Icaraí or the Centre, where there are almost no lots.
Spread by neighbourhood (sample)
Neighbourhood
n
Median
P25–P75
Engenho do Mato
37
R$ 597
R$ 472–R$ 709
Serra Grande
37
R$ 667
R$ 421–R$ 944
Itaipu
26
R$ 667
R$ 406–R$ 899
Várzea das Moças
23
R$ 252
R$ 151–R$ 372
Badu
19
R$ 546
R$ 306–R$ 871
Maravista
10
R$ 515
R$ 472–R$ 733
Mata Paca
10
R$ 252
R$ 218–R$ 286
Piratininga
10
R$ 1,110
R$ 756–R$ 1,359
Rio do Ouro
7
R$ 371
R$ 236–R$ 425
Vila Progresso
5
R$ 525
R$ 521–R$ 595
Maceió
3
R$ 1,254
R$ 654–R$ 1,368
Jacaré
2
R$ 544
R$ 477–R$ 611
Largo da Batalha
2
R$ 333
R$ 326–R$ 340
Maria Paula
2
R$ 418
R$ 292–R$ 544
Sapê
2
R$ 284
R$ 279–R$ 288
Score breakdown
Each criterion's score, its weight in the total and the raw figure, linked to its source.
raw: 36.45 per 100k pop. · 40% violent deaths (log 30→0, 0.5→10 per 100k) + 30% city robbery ÷ country average (log 5×→0, 0.5×→10) + 30% share who feel safe at night (lin 30%→0, 95%→10); any part without data: weights renormalized
Composite safety: violent deaths 36.5 per 100k → 0.0 (weight 40%) · robbery 1.10× the country average (municipality of Niterói, 2024) → 6.6 (weight 30%) · 51.0% feel safe walking alone at night (Brazil (national), 2024) → 3.2 (weight 30%).
raw: 5.0 km · beach: log distance 5 km→10, 150 km→0, searched up to 100 km since 2026-11-12 (before, up to 60 km); mountains: richness of nature leisure (mean of the top 3 of 4 counts, 50 km) × access (1 up to 15 km → 0 at 150 km, log), 0 without relief; score = min(10, max(beach, mountain) + 0.3·min)
100 km radius (2026-11-12): beach within 5 km → beach 10.00; mountains 10.00; score 10.00 (before 10.00).
raw: 21.0 count of OSM objects · 50% log1p(count within 2 km), 60→10 + 50% log1p(per 10k pop.), 15→10 · since 2026-11-12: 60% this local score + 40% a regional score up to 100 km (rings 0–30/30–60/60–100 km weighted 1/0.5/0.2; count and density per inhabitant; METODOLOGIA §25)
100 km radius (2026-11-12): 1,699 parks at 0–30 km, 1,297 at 30–60 km and 481 at 60–100 km (OSM, ohsome 2026-07-27); weighted 1/0.5/0.2 = 2,444 = 2,444; weighted population 10,979,616 (GHS-POP 2025) → 2.23 per 10k people. Regional score 7.05. Local score 6.08 (weight 60%) and regional 7.05 (weight 40%) → 6.47.
raw: 1449.0 active businesses (CNPJ) · Average of two mapping sources, OpenStreetMap and Overture Maps (Overture count ÷ K, K = median Overture/OSM ratio across the 39 cities: 2.57 within 2 km, 3.41 in the municipality); each source: 50% log1p(count within 2 km), 1000→10 + 50% log1p(per 10k pop.), 30→10. Brazil: 50% of that score + 50% log1p(CNPJ per 10k pop. ÷ K), 30→10 · since 2026-11-12: 60% this local score + 40% a regional score up to 100 km (rings 0–30/30–60/60–100 km weighted 1/0.5/0.2; count and density per inhabitant; METODOLOGIA §25)
100 km radius (2026-11-12): 1,948 restaurants at 0–30 km, 463 at 30–60 km and 179 at 60–100 km (OSM, ohsome 2026-07-27); weighted 1/0.5/0.2 = 2,215 × OSM completeness factor 1.17 (Overture in the municipality) = 2,593; weighted population 10,979,616 (GHS-POP 2025) → 2.36 per 10k people. Regional score 6.18. Local score 4.83 (weight 60%) and regional 6.18 (weight 40%) → 5.37.
raw: 85.9 destinations + venues weighted by distance (rings up to 100 km) · 50% log1p(weighted count), 110→10 + 50% log1p(per million people in the region, GHSL), 32.0→10; rings 0–30/30–60/60–100 km weighted 1/0.5/0.2 (since 2026-11-12; before: count within 50 km, 120→10)
100 km radius (2026-11-12): 58 destinations and venues at 0–30 km, 49 at 30–60 km and 17 at 60–100 km (OSM, ohsome 2026-07-27); weighted 1/0.5/0.2 = 86 = 86; weighted population 10,979,616 (GHS-POP 2025) → 7.82 per million people. Regional score 7.85.
raw: 446.0 active businesses (CNPJ) · Average of two mapping sources, OpenStreetMap and Overture Maps (Overture count ÷ K, K = median Overture/OSM ratio across the 39 cities: 2.48 within 2 km, 3.20 in the municipality); each source: 50% log1p(count within 2 km), 500→10 + 50% log1p(per 10k pop.), 10→10. Brazil: 50% of that score + 50% log1p(CNPJ per 10k pop. ÷ K), 10→10 · since 2026-11-12: 60% this local score + 40% a regional score up to 100 km (rings 0–30/30–60/60–100 km weighted 1/0.5/0.2; count and density per inhabitant; METODOLOGIA §25)
100 km radius (2026-11-12): 1,110 bars at 0–30 km, 182 at 30–60 km and 65 at 60–100 km (OSM, ohsome 2026-07-27); weighted 1/0.5/0.2 = 1,214 × OSM completeness factor 1.23 (Overture in the municipality) = 1,488; weighted population 10,979,616 (GHS-POP 2025) → 1.35 per 10k people. Regional score 5.99. Local score 4.09 (weight 60%) and regional 5.99 (weight 40%) → 4.85.
raw: 76.023 years · average: life expectancy lin 70→0, 85→10; Brazil: beds/10k pop. lin 0→0, 50→10; World: OSM hospitals within 10 km log1p 50→10
Clean airestimated · score 7.43 · weight 4.14%
Estimate: ESTIMATE (not a measurement): the city has no station in the WHO air quality database. Brazil's national average (World Bank, 2023: 13.38 µg/m³) × the city÷Brazil ratio of satellite-derived PM2.5 in the municipality (AQLI/University of Chicago, ACAG/Washington University in St. Louis data, 2023: 11.54 in the city ÷ 12.14 in Brazil, population-weighted = 0.951) = 12.7 µg/m³. Range 12.2–13.2 = same calculation with each year's ratio from 2019 to 2023. AQLI's satellite series excludes mineral dust and sea salt, so we only use the city-to-country ratio, not the absolute value.
PM2.5 = mean of the 2021–2024 annual means (2023: 11.3; 2024: 10.2 µg/m³) = 10.7 µg/m³; lowest and highest year 10.2–11.3. Source: WHO Ambient Air Quality Database v8 (2026), available 2021–2024 annual means; station: base da OMS v8 (rede estadual). Rule (Nov 11, 2026): four-year mean, so the score does not hinge on one fire or drought year.
raw: 29.0 count of OSM objects · log1p(count), 150→10 · since 2026-11-12: 60% this local score + 40% a regional score up to 100 km (rings 0–30/30–60/60–100 km weighted 1/0.5/0.2; count and density per inhabitant; METODOLOGIA §25)
100 km radius (2026-11-12): 338 cultural venues at 0–30 km, 80 at 30–60 km and 51 at 60–100 km (OSM, ohsome 2026-07-27); weighted 1/0.5/0.2 = 388 = 388; weighted population 10,979,616 (GHS-POP 2025) → 3.54 per 100k people. Regional score 8.22. Local score 6.78 (weight 60%) and regional 8.22 (weight 40%) → 7.35.
The city
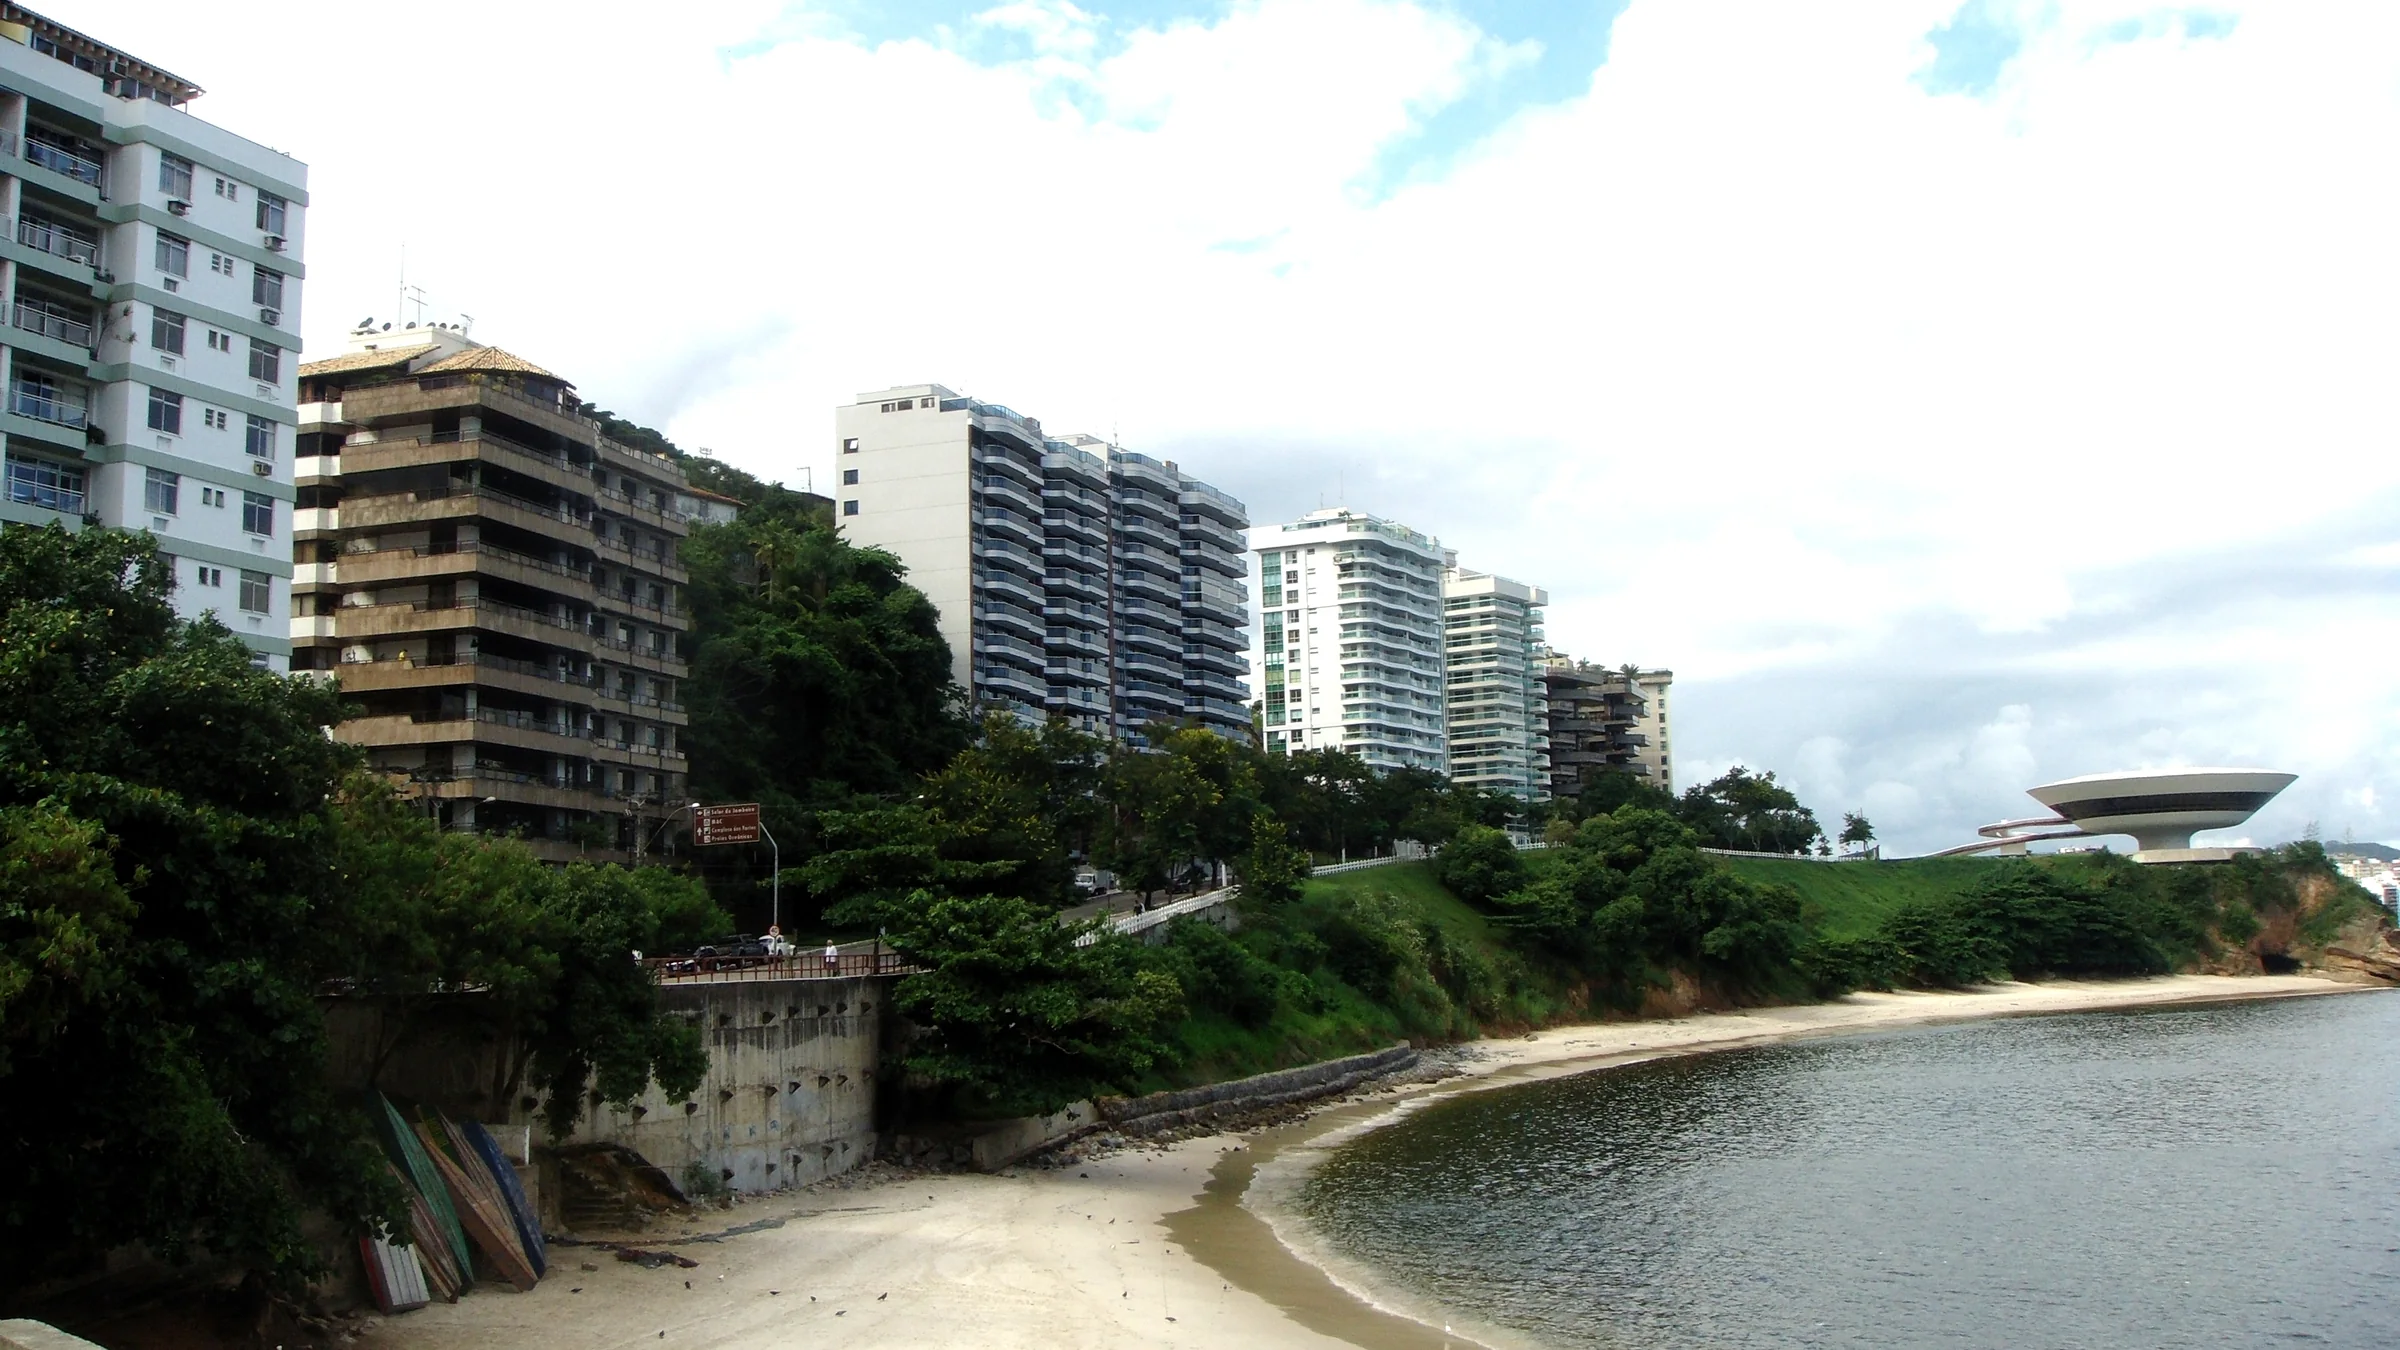
Niterói is a Brazilian municipality in the Rio de Janeiro Metropolitan Region, in the state of Rio de Janeiro. It was the state capital, as shown by its golden mural crown, reserved for capitals, from 1834 to 1894 and again from 1903 to 1975. With an estimated population of 481,749 according to the Brazilian Institute of Geography and Statistics (IBGE) in 2022, and an area of 133.757 km², it has the highest Municipal Human Development Index (MHDI) in Rio de Janeiro state and the seventh highest among Brazilian municipalities in 2010. On its own, it is the municipality with the second highest average monthly household income per capita in Brazil and ranks 13th among the country's municipalities on education indicators.
English rendering of the Portuguese Wikipedia summary linked below. Source: wikipedia_pt. Wikipedia revision 73398164 (2026-11-08T17:00:05Z).
Taxation
ITBI; no official local rate collected yet (we do not invent the figure). GAP: rate found only in secondary sources (sometimes conflicting); to be confirmed in the law or on the city's page
IPTU; no official local rate collected yet (we do not invent the figure). GAP: progressive tables by assessed value/use; to be collected from municipal law
Frequently asked questions
What is the Onde Viver Bem score for Niterói?
Niterói has an indicative score of 6.13/10 in the Brazil ranking, updated November 18, 2026. Cost of living is not part of the score.
What are the strengths and weaknesses of the score for Niterói?
The strongest published variables are Airport (10.00), Beach / mountains (10.00) and Water (8.86); the weakest are Safety (2.94), Bars (4.85) and Restaurants (5.37).
Does cost of living or the land price per m² enter the score?
No. Cost of living and the land price per m² appear on the page but are not part of the score. See the methodology.
How is the score calculated?
It is an indicative 0–10 quality-of-life index, with 13 variables and published weights. Safety has a 15% weight and, when local data exist, a lethal-violence penalty may cap the total. The full method is on the methodology page.
Are any figures on this page estimates?
Yes. Some values are documented estimates, labelled with the “estimated” badge in the technical notes. The method is explained in the Estimates section.
Download the image and post it to your feed, story or video. To send people to the site, use the link sticker in your story or the link in your bio (links in captions are not clickable).
Informational content and indicative scores. This is not advice on investing, immigration, buying property or choosing a career. Every metric cites its source; cost of living is not part of the score.