Best cities to live in Brazil
Onde Viver Bem rates 58 cities in Brazil in this update. The highest score belongs to Gramado (7.30, #65 of 175 in the global ranking); the lowest to Porto Velho (4.38, #175 of 175).
Criteria where cities in Brazil sit furthest above the median of the database: Mild climate (8.39 vs 5.78); Sun (7.77 vs 7.04). Furthest below: Restaurants (5.02 vs 7.03); Airport (7.83 vs 9.70).
Scores from 0 to 10 per criterion; median of the cities in the country vs the median of all 175 cities. Each number's detail and source are on each city page.
Score × land price per m²
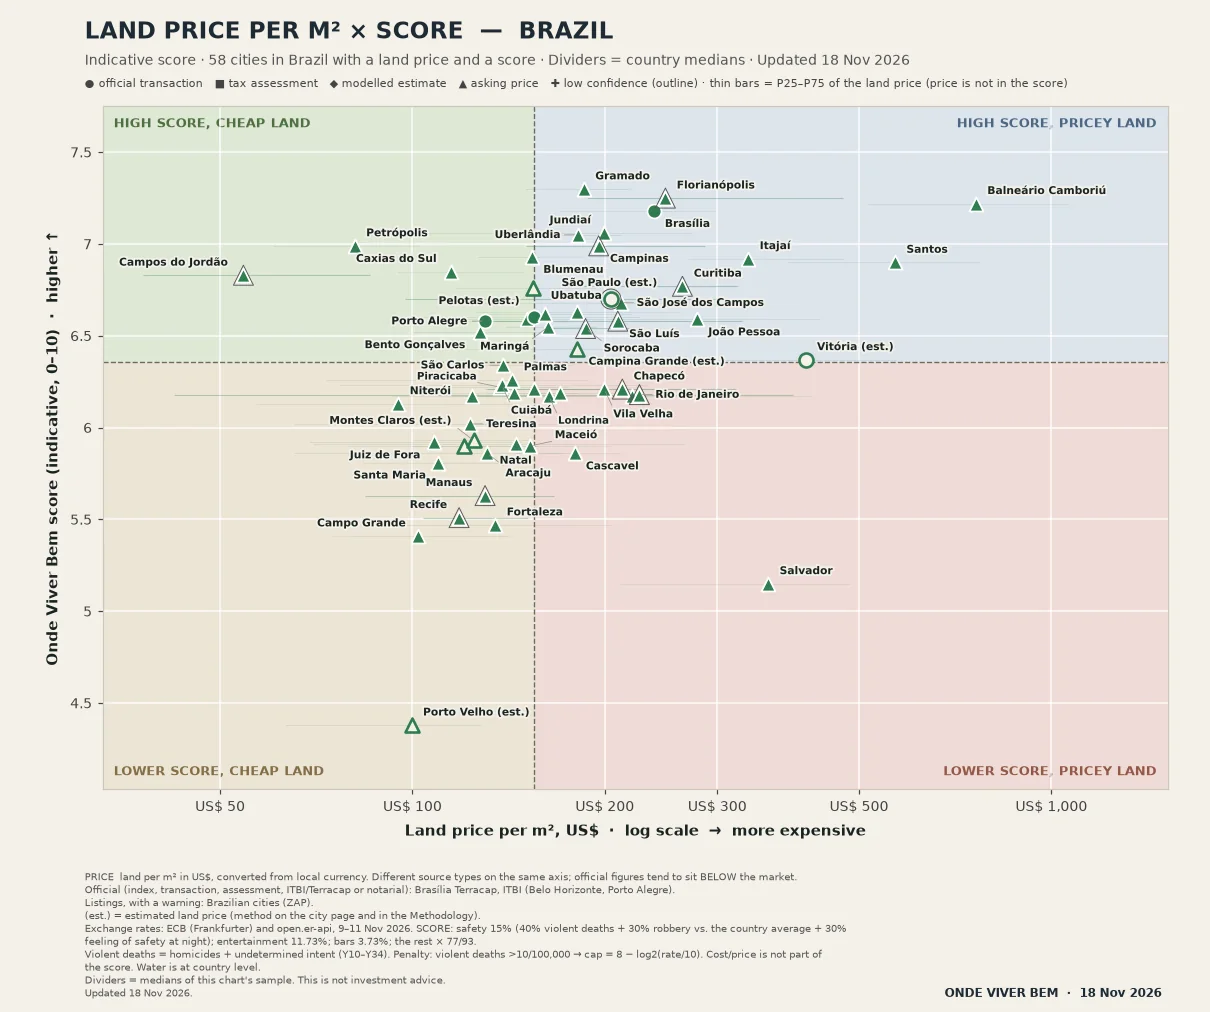
● official transaction ■ tax assessment ◆ modelled estimate ▲ asking price ✚ low confidence (outline) · thin bars = P25–P75 of the land price (price is not in the score). On phones, the narrow version of the chart leaves out the P25–P75 bars and labels only highlights and extremes; the full list of points is below.
Chart sources and notes
PRICE land per m² in US$, converted from local currency. Different source types on the same axis; official figures tend to sit BELOW the market.
Official (index, transaction, assessment, ITBI/Terracap or notarial): Brasília Terracap, ITBI (Belo Horizonte, Porto Alegre).
Listings, with a warning: Brazilian cities (ZAP).
(est.) = estimated land price (method on the city page and in the Methodology).
Exchange rates: ECB (Frankfurter) and open.er-api, 9–11 Nov 2026. SCORE: safety 15% (40% violent deaths + 30% robbery vs. the country average + 30% feeling of safety at night); entertainment 11.73%; bars 3.73%; the rest × 77/93.
Violent deaths = homicides + undetermined intent (Y10–Y34). Penalty: violent deaths >10/100,000 → cap = 8 − log2(rate/10). Cost/price is not part of the score. Water is at country level.
Dividers = medians of this chart's sample. This is not investment advice.
Updated 18 Nov 2026.
All 58 points, highest score first
- Gramado score 7.30 · US$ 186/m²
- Florianópolis score 7.25 · US$ 249/m²
- Balneário Camboriú score 7.22 · US$ 762/m²
- Brasília score 7.18 · US$ 238/m²
- Jundiaí score 7.06 · US$ 199/m²
- Uberlândia score 7.05 · US$ 181/m²
- Campinas score 6.99 · US$ 196/m²
- Petrópolis score 6.99 · US$ 81/m²
- Blumenau score 6.93 · US$ 154/m²
- Itajaí score 6.92 · US$ 336/m²
- Santos score 6.90 · US$ 569/m²
- Caxias do Sul score 6.85 · US$ 115/m²
- Campos do Jordão score 6.83 · US$ 54/m²
- Curitiba score 6.77 · US$ 265/m²
- Pelotas score 6.76 · US$ 154/m² (est.)
- São Paulo score 6.70 · US$ 204/m² (est.)
- São José dos Campos score 6.68 · US$ 212/m²
- Ubatuba score 6.63 · US$ 181/m²
- Joinville score 6.62 · US$ 161/m²
- Belo Horizonte score 6.60 · US$ 155/m²
- Goiânia score 6.59 · US$ 151/m²
- João Pessoa score 6.59 · US$ 279/m²
- Porto Alegre score 6.58 · US$ 130/m²
- São Luís score 6.58 · US$ 210/m²
- Maringá score 6.55 · US$ 163/m²
- Sorocaba score 6.54 · US$ 187/m²
- Bento Gonçalves score 6.52 · US$ 128/m²
- Campina Grande score 6.43 · US$ 181/m² (est.)
- Vitória score 6.37 · US$ 412/m² (est.)
- São Carlos score 6.34 · US$ 138/m²
- Palmas score 6.26 · US$ 143/m²
- Cuiabá score 6.23 · US$ 138/m²
- Piracicaba score 6.22 · US$ 137/m²
- Chapecó score 6.21 · US$ 213/m²
- Foz do Iguaçu score 6.21 · US$ 155/m²
- Vila Velha score 6.21 · US$ 200/m²
- Bauru score 6.19 · US$ 144/m²
- Ribeirão Preto score 6.19 · US$ 170/m²
- Rio de Janeiro score 6.18 · US$ 227/m²
- Belém score 6.17 · US$ 220/m²
- Londrina score 6.17 · US$ 164/m²
- São José do Rio Preto score 6.17 · US$ 124/m²
- Niterói score 6.13 · US$ 95/m²
- Teresina score 6.02 · US$ 123/m²
- Montes Claros score 5.93 · US$ 125/m² (est.)
- Juiz de Fora score 5.92 · US$ 108/m²
- Natal score 5.91 · US$ 145/m²
- Anápolis score 5.90 · US$ 120/m² (est.)
- Maceió score 5.90 · US$ 153/m²
- Aracaju score 5.86 · US$ 131/m²
- Cascavel score 5.86 · US$ 179/m²
- Santa Maria score 5.81 · US$ 110/m²
- Manaus score 5.63 · US$ 130/m²
- Recife score 5.51 · US$ 118/m²
- Fortaleza score 5.47 · US$ 135/m²
- Campo Grande score 5.41 · US$ 102/m²
- Salvador score 5.15 · US$ 360/m²
- Porto Velho score 4.38 · US$ 100/m² (est.)
Explore by country
Most cities: Brazil Spain United States France Australia See all 42 countries
Cities in the ranking
“#” is the rank among the cities in the country; “Global” is the position in the global ranking (175 cities). Scores are indicative.
| # Rank within country | City | Score | Global | Land price per m² |
|---|---|---|---|---|
| 1 | Gramado See the dataGlobal 65/175 | 7.30 * | 65/175 | R$ 1,023/m² * |
| 2 | Florianópolis See the dataRead the analysisWatch the videoGlobal 71/175 | 7.25 * | 71/175 | R$ 1,373/m² * |
| 3 | Balneário Camboriú See the dataGlobal 74/175 | 7.22 * | 74/175 | R$ 4,204/m² * |
| 4 | Brasília See the dataRead the analysisWatch the videoGlobal 78/175 | 7.18 * | 78/175 | R$ 1,315/m² |
| 5 | Jundiaí See the dataGlobal 91/175 | 7.06 * | 91/175 | R$ 1,100/m² * |
| 6 | Uberlândia See the dataGlobal 95/175 | 7.05 * | 95/175 | R$ 1,000/m² * |
| 7 | Campinas See the dataGlobal 101/175 | 6.99 * | 101/175 | R$ 1,079/m² * |
| 8 | Petrópolis See the dataGlobal 102/175 | 6.99 * | 102/175 | R$ 448/m² * |
| 9 | Blumenau See the dataGlobal 105/175 | 6.93 * | 105/175 | R$ 849/m² * |
| 10 | Itajaí See the dataGlobal 107/175 | 6.92 * | 107/175 | R$ 1,851/m² * |
| 11 | Santos See the dataGlobal 108/175 | 6.90 * | 108/175 | R$ 3,141/m² * |
| 12 | Caxias do Sul See the dataGlobal 111/175 | 6.85 * | 111/175 | R$ 635/m² * |
| 13 | Campos do Jordão See the dataGlobal 113/175 | 6.83 * | 113/175 | R$ 300/m² * |
| 14 | Curitiba See the dataGlobal 116/175 | 6.77 * | 116/175 | R$ 1,460/m² * |
| 15 | Pelotas See the dataGlobal 119/175 | 6.76 * | 119/175 | R$ 851/m² * |
| 16 | São Paulo See the dataGlobal 121/175 | 6.70 * | 121/175 | R$ 1,128/m² * |
| 17 | São José dos Campos See the dataGlobal 123/175 | 6.68 * | 123/175 | R$ 1,169/m² * |
| 18 | Ubatuba See the dataGlobal 124/175 | 6.63 * | 124/175 | R$ 997/m² * |
| 19 | Joinville See the dataGlobal 125/175 | 6.62 * | 125/175 | R$ 891/m² * |
| 20 | Belo Horizonte See the dataGlobal 126/175 | 6.60 * | 126/175 | R$ 854/m² * |
| 21 | Goiânia See the dataGlobal 127/175 | 6.59 * | 127/175 | R$ 833/m² * |
| 22 | João Pessoa See the dataGlobal 128/175 | 6.59 * | 128/175 | R$ 1,538/m² * |
| 23 | Porto Alegre See the dataGlobal 129/175 | 6.58 * | 129/175 | R$ 717/m² |
| 24 | São Luís See the dataGlobal 130/175 | 6.58 * | 130/175 | R$ 1,156/m² * |
| 25 | Maringá See the dataGlobal 132/175 | 6.55 * | 132/175 | R$ 900/m² * |
| 26 | Sorocaba See the dataGlobal 133/175 | 6.54 * | 133/175 | R$ 1,029/m² * |
| 27 | Bento Gonçalves See the dataGlobal 134/175 | 6.52 * | 134/175 | R$ 704/m² * |
| 28 | Campina Grande See the dataGlobal 137/175 | 6.43 * | 137/175 | R$ 999/m² * |
| 29 | Vitória See the dataGlobal 138/175 | 6.37 * | 138/175 | R$ 2,275/m² * |
| 30 | São Carlos See the dataGlobal 141/175 | 6.34 * | 141/175 | R$ 763/m² * |
| 31 | Palmas See the dataGlobal 142/175 | 6.26 * | 142/175 | R$ 791/m² * |
| 32 | Cuiabá See the dataGlobal 143/175 | 6.23 * | 143/175 | R$ 761/m² * |
| 33 | Piracicaba See the dataGlobal 144/175 | 6.22 * | 144/175 | R$ 756/m² * |
| 34 | Chapecó See the dataGlobal 145/175 | 6.21 * | 145/175 | R$ 1,175/m² * |
| 35 | Foz do Iguaçu See the dataGlobal 146/175 | 6.21 * | 146/175 | R$ 854/m² * |
| 36 | Vila Velha See the dataGlobal 147/175 | 6.21 * | 147/175 | R$ 1,101/m² * |
| 37 | Bauru See the dataGlobal 148/175 | 6.19 * | 148/175 | R$ 796/m² * |
| 38 | Ribeirão Preto See the dataGlobal 149/175 | 6.19 * | 149/175 | R$ 940/m² * |
| 39 | Rio de Janeiro See the dataGlobal 150/175 | 6.18 * | 150/175 | R$ 1,250/m² * |
| 40 | Belém See the dataGlobal 151/175 | 6.17 * | 151/175 | R$ 1,216/m² * |
| 41 | Londrina See the dataGlobal 152/175 | 6.17 * | 152/175 | R$ 902/m² * |
| 42 | São José do Rio Preto See the dataGlobal 153/175 | 6.17 * | 153/175 | R$ 684/m² * |
| 43 | Niterói See the dataGlobal 154/175 | 6.13 * | 154/175 | R$ 524/m² * |
| 44 | Teresina See the dataGlobal 157/175 | 6.02 * | 157/175 | R$ 679/m² * |
| 45 | Montes Claros See the dataGlobal 158/175 | 5.93 * | 158/175 | R$ 688/m² * |
| 46 | Juiz de Fora See the dataGlobal 159/175 | 5.92 * | 159/175 | R$ 596/m² * |
| 47 | Natal See the dataGlobal 160/175 | 5.91 * | 160/175 | R$ 800/m² * |
| 48 | Anápolis See the dataGlobal 161/175 | 5.90 * | 161/175 | R$ 664/m² * |
| 49 | Maceió See the dataGlobal 162/175 | 5.90 * | 162/175 | R$ 842/m² * |
| 50 | Aracaju See the dataGlobal 163/175 | 5.86 * | 163/175 | R$ 722/m² * |
| 51 | Cascavel See the dataGlobal 164/175 | 5.86 * | 164/175 | R$ 989/m² * |
| 52 | Santa Maria See the dataGlobal 165/175 | 5.81 * | 165/175 | R$ 604/m² * |
| 53 | Manaus See the dataGlobal 167/175 | 5.63 * | 167/175 | R$ 717/m² * |
| 54 | Recife See the dataGlobal 168/175 | 5.51 * | 168/175 | R$ 653/m² * |
| 55 | Fortaleza See the dataGlobal 169/175 | 5.47 * | 169/175 | R$ 744/m² * |
| 56 | Campo Grande See the dataGlobal 170/175 | 5.41 * | 170/175 | R$ 564/m² * |
| 57 | Salvador See the dataGlobal 172/175 | 5.15 * | 172/175 | R$ 1,989/m² * |
| 58 | Porto Velho See the dataGlobal 175/175 | 4.38 * | 175/175 | R$ 550/m² * |
Data-quality note. Hover the icon (or use a screen reader) to read the summary; the range, the source and the details are on each city's page.
Coverage and limits
The list does not cover every city in Brazil: it includes only those the database rates in this update (November 18, 2026), with the same rule for all 175 cities. Scores are editorial and indicative, cost of living is not part of the score, and the land price per m² is shown only for comparison. Read the methodology.
Keep exploring
Share this page

Card for Instagram and TikTok
Download the image and post it to your feed, story or video. To send people to the site, use the link sticker in your story or the link in your bio (links in captions are not clickable).
Download card (PNG 1080×1350)