Updated November 18, 2026. Indicative score. Weights: entertainment 11.73% (destinations and venues, rings up to 100 km); bars 3.73%; safety 15% with a penalty; water at country level; land price per m² = official source (ITBI, Terracap, registries, valuations) or listings with a caveat · coverage 100%
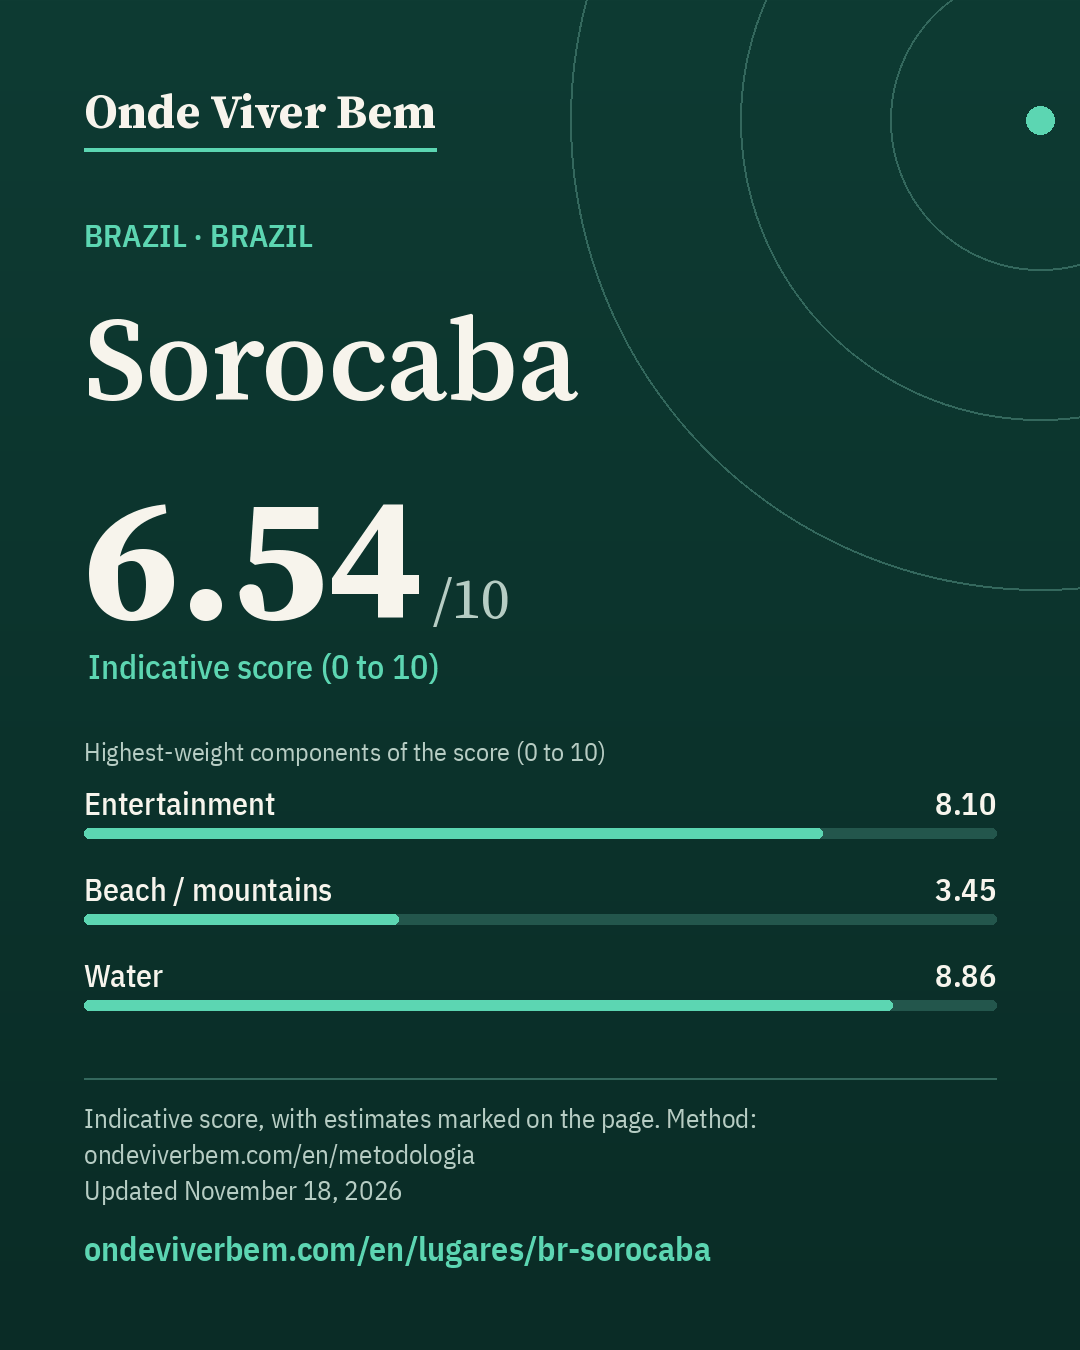
Sorocaba has an indicative score of 6.54/10 in the Brazil ranking of Onde Viver Bem, updated November 18, 2026. The strongest published variables are Parks (9.73), Water (8.86) and Mild climate (8.37); the weakest are Beach / mountains (3.45), Bars (4.40) and Safety (4.63). The scores are indicative. Cost of living is not part of the score. The published land price per m² is R$ 1,029/m² (listing); that price is not part of the score. Some figures on this page are estimates and carry the “estimated” badge.
safety: feeling of safety at national level only (Gallup, 2024 survey, 2025 report); estimated – no comparable municipal figure: robbery imputed (0.55× = median of the ratios measured in Brazil); estimated: air (PM2.5 AQLI/ACAG 2019–2023 ratios × World Bank Brazil 2023; no representative official station; data from before 2025)
Land price per m²
R$ 1,029/m²listingP25–P75 R$ 882–R$ 1,233 · n=67
· small sample
lot listings (asking price) — ZAP, 15/11/2026; listings with a notice
Note: Asking price in listings, not a transaction price. Limited sample: n=67 listings in 44 neighbourhoods; use the P25–P75 range (R$882.04 to R$1,232.77).
Score breakdown
Each criterion's score, its weight in the total and the raw figure, linked to its source.
Safetyestimatedrobbery: no comparable municipal data · score 4.63 · weight 15.00%
raw: 13.43 per 100k pop. · 40% violent deaths (log 30→0, 0.5→10 per 100k) + 30% city robbery ÷ country average (log 5×→0, 0.5×→10) + 30% share who feel safe at night (lin 30%→0, 95%→10); any part without data: weights renormalized
Composite safety: violent deaths 13.4 per 100k → 2.0 (weight 40%) · ESTIMATED robbery 0.55× the country average (median of comparable cities; range 0.13–2.88×) → 9.6 (weight 30%) estimated · 51.0% feel safe walking alone at night (Brazil (national), 2024) → 3.2 (weight 30%).
raw: 60.0 km · beach: log distance 5 km→10, 150 km→0, searched up to 100 km since 2026-11-12 (before, up to 60 km); mountains: richness of nature leisure (mean of the top 3 of 4 counts, 50 km) × access (1 up to 15 km → 0 at 150 km, log), 0 without relief; score = min(10, max(beach, mountain) + 0.3·min)
100 km radius (2026-11-12): beach within 60 km (includes lake/river) → beach 2.69; mountains 2.52; score 3.45 (before 3.45).
raw: 186.0 count of OSM objects · 50% log1p(count within 2 km), 60→10 + 50% log1p(per 10k pop.), 15→10 · since 2026-11-12: 60% this local score + 40% a regional score up to 100 km (rings 0–30/30–60/60–100 km weighted 1/0.5/0.2; count and density per inhabitant; METODOLOGIA §25)
100 km radius (2026-11-12): 1,735 parks at 0–30 km, 1,481 at 30–60 km and 9,583 at 60–100 km (OSM, ohsome 2026-07-27); weighted 1/0.5/0.2 = 4,392 = 4,392; weighted population 6,192,453 (GHS-POP 2025) → 7.09 per 10k people. Regional score 9.33. Local score 10.00 (weight 60%) and regional 9.33 (weight 40%) → 9.73.
raw: 59.0 count of OSM objects · Average of two mapping sources, OpenStreetMap and Overture Maps (Overture count ÷ K, K = median Overture/OSM ratio across the 39 cities: 2.57 within 2 km, 3.41 in the municipality); each source: 50% log1p(count within 2 km), 1000→10 + 50% log1p(per 10k pop.), 30→10. Brazil: 50% of that score + 50% log1p(CNPJ per 10k pop. ÷ K), 30→10 · since 2026-11-12: 60% this local score + 40% a regional score up to 100 km (rings 0–30/30–60/60–100 km weighted 1/0.5/0.2; count and density per inhabitant; METODOLOGIA §25)
100 km radius (2026-11-12): 194 restaurants at 0–30 km, 265 at 30–60 km and 3,953 at 60–100 km (OSM, ohsome 2026-07-27); weighted 1/0.5/0.2 = 1,117 = 1,117; weighted population 6,192,453 (GHS-POP 2025) → 1.80 per 10k people. Regional score 5.43. Local score 4.57 (weight 60%) and regional 5.43 (weight 40%) → 4.92.
raw: 69.6 destinations + venues weighted by distance (rings up to 100 km) · 50% log1p(weighted count), 110→10 + 50% log1p(per million people in the region, GHSL), 32.0→10; rings 0–30/30–60/60–100 km weighted 1/0.5/0.2 (since 2026-11-12; before: count within 50 km, 120→10)
100 km radius (2026-11-12): 15 destinations and venues at 0–30 km, 60 at 30–60 km and 123 at 60–100 km (OSM, ohsome 2026-07-27); weighted 1/0.5/0.2 = 70 = 70; weighted population 6,192,453 (GHS-POP 2025) → 11.24 per million people. Regional score 8.10.
raw: 19.0 count of OSM objects · Average of two mapping sources, OpenStreetMap and Overture Maps (Overture count ÷ K, K = median Overture/OSM ratio across the 39 cities: 2.48 within 2 km, 3.20 in the municipality); each source: 50% log1p(count within 2 km), 500→10 + 50% log1p(per 10k pop.), 10→10. Brazil: 50% of that score + 50% log1p(CNPJ per 10k pop. ÷ K), 10→10 · since 2026-11-12: 60% this local score + 40% a regional score up to 100 km (rings 0–30/30–60/60–100 km weighted 1/0.5/0.2; count and density per inhabitant; METODOLOGIA §25)
100 km radius (2026-11-12): 79 bars at 0–30 km, 78 at 30–60 km and 1,475 at 60–100 km (OSM, ohsome 2026-07-27); weighted 1/0.5/0.2 = 413 = 413; weighted population 6,192,453 (GHS-POP 2025) → 0.67 per 10k people. Regional score 4.56. Local score 4.30 (weight 60%) and regional 4.56 (weight 40%) → 4.40.
Estimate: ESTIMATE (not a measurement): the city has no official PM2.5 series meeting the methodology's minimum years. Point 17.09 µg/m³ = 13.38 (WB Brazil 2023) × the city÷Brazil ratio in AQLI/ACAG GADM2. Range 16.2–17.1 from the 2019–2023 ratios. 2024 CAMS at the city centre: 11.245 µg/m³ (comparison, not the point).
raw: 0.0 civil IATA airports with scheduled service (B12, 50 km) · 0 airports → 0; 1 → 7; 2 or more → 10, with an airport at 50–100 km counting 1 → 0.25 (linear) since 2026-11-12
100 km radius (2026-11-12): 0 within 50 km + with scheduled flights at 50–100 km: VCP 64 km (weight 0.79); CGH 83 km (weight 0.51) → 1.29 equivalent airport(s), score 7.88.
raw: 23.0 count of OSM objects · log1p(count), 150→10 · since 2026-11-12: 60% this local score + 40% a regional score up to 100 km (rings 0–30/30–60/60–100 km weighted 1/0.5/0.2; count and density per inhabitant; METODOLOGIA §25)
100 km radius (2026-11-12): 37 cultural venues at 0–30 km, 77 at 30–60 km and 561 at 60–100 km (OSM, ohsome 2026-07-27); weighted 1/0.5/0.2 = 188 = 188; weighted population 6,192,453 (GHS-POP 2025) → 3.03 per 100k people. Regional score 7.39. Local score 6.33 (weight 60%) and regional 7.39 (weight 40%) → 6.76.
The city
Sorocaba is a Brazilian municipality in inland São Paulo state. It covers 450.38 km² and is the sixth most populous city in the state, the second most populous inland city in Brazil and the most populous in south-western São Paulo state, with 762,172 inhabitants according to the IBGE estimate published in the Diário Oficial da União on 28 August 2025. It is a regional capital.
English rendering of the Portuguese Wikipedia summary linked below. Source: wikipedia_pt. Wikipedia revision 73354987 (2026-11-03T09:14:33Z).
Taxation
Taxation; no official local rate collected yet (we do not invent the figure). GAP: tax data not extracted with a source and URL in this batch
Frequently asked questions
What is the Onde Viver Bem score for Sorocaba?
Sorocaba has an indicative score of 6.54/10 in the Brazil ranking, updated November 18, 2026. Cost of living is not part of the score.
What are the strengths and weaknesses of the score for Sorocaba?
The strongest published variables are Parks (9.73), Water (8.86) and Mild climate (8.37); the weakest are Beach / mountains (3.45), Bars (4.40) and Safety (4.63).
Does cost of living or the land price per m² enter the score?
No. Cost of living and the land price per m² appear on the page but are not part of the score. See the methodology.
How is the score calculated?
It is an indicative 0–10 quality-of-life index, with 13 variables and published weights. Safety has a 15% weight and, when local data exist, a lethal-violence penalty may cap the total. The full method is on the methodology page.
Are any figures on this page estimates?
Yes. Some values are documented estimates, labelled with the “estimated” badge in the technical notes. The method is explained in the Estimates section.
Download the image and post it to your feed, story or video. To send people to the site, use the link sticker in your story or the link in your bio (links in captions are not clickable).
Informational content and indicative scores. This is not advice on investing, immigration, buying property or choosing a career. Every metric cites its source; cost of living is not part of the score.