Updated November 18, 2026. Indicative score. Weights: entertainment 11.73% (destinations and venues, rings up to 100 km); bars 3.73%; safety 15% with a penalty; water at country level; land price per m² = official source (ITBI, Terracap, registries, valuations) or listings with a caveat · coverage 100%
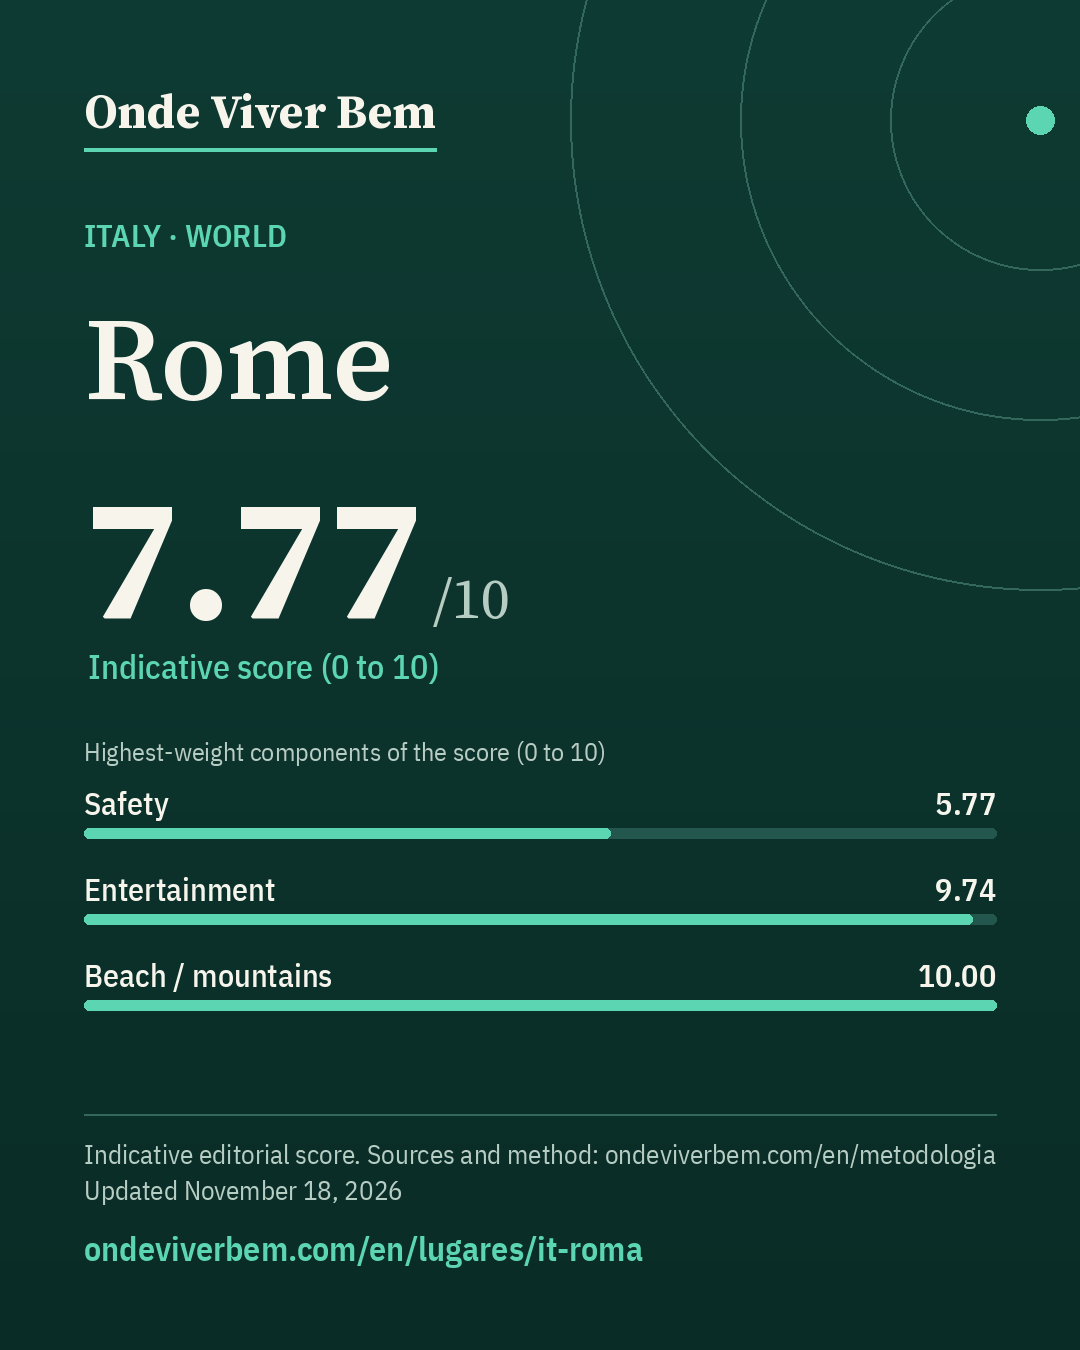
Rome has an indicative score of 7.77/10 in the World ranking of Onde Viver Bem, updated November 18, 2026. The strongest published variables are Airport (10.00), Culture (10.00) and Beach / mountains (10.00); the weakest are Mild climate (3.70), Sun (5.48) and Safety (5.77). The scores are indicative. Cost of living is not part of the score. The published land price per m² is US$ 242/m² (listing); that price is not part of the score.
buildable land for sale in semi-central and peripheral zones (OMI C/D); median plot 1,200 m²; caasa.it listings, 10 November 2026, sample n=29 · source
Collected November 10, 2026 · exchange rate EUR 0.89342 per US$ (Frankfurter API (ECB reference rates), 2026-11-09)
Note: Buildable land for sale in semi-central and peripheral zones (OMI C/D); median plot 1,200 m²; this is not a housing price per m² (Idealista, October 2026: € 3,801/m²). Asking price in a listing, not a transaction price. The Agenzia delle Entrate does not quote land (OMI FAQ). Small sample (29 listings). The 1.5× IQR was applied after the zone filter; a near-duplicate in Torrevecchia was removed (same address and area, prices € 188,000 and € 188,240). The centre has almost no plots for sale. Immobiliare.it, Idealista and Casa.it blocked access (403).
Score breakdown
Each criterion's score, its weight in the total and the raw figure, linked to its source.
raw: 0.45 per 100k pop. · 40% violent deaths (log 30→0, 0.5→10 per 100k) + 30% city robbery ÷ country average (log 5×→0, 0.5×→10) + 30% share who feel safe at night (lin 30%→0, 95%→10); any part without data: weights renormalized
Composite safety: violent deaths 0.5 per 100k → 10.0 (weight 40%) · robbery 1.63× the country average (province (Città metropolitana) of Rome, 2024) → 4.9 (weight 30%) · 36.8% feel safe walking alone at night (Rome IT001C, 2023) → 1.1 (weight 30%).
raw: 5.0 km · beach: log distance 5 km→10, 150 km→0, searched up to 100 km since 2026-11-12 (before, up to 60 km); mountains: richness of nature leisure (mean of the top 3 of 4 counts, 50 km) × access (1 up to 15 km → 0 at 150 km, log), 0 without relief; score = min(10, max(beach, mountain) + 0.3·min)
100 km radius (2026-11-12): beach within 5 km (includes lake/river) → beach 10.00; mountains 6.99; score 10.00 (before 10.00).
raw: 88.0 count of OSM objects · 50% log1p(count within 2 km), 60→10 + 50% log1p(per 10k pop.), 15→10 · since 2026-11-12: 60% this local score + 40% a regional score up to 100 km (rings 0–30/30–60/60–100 km weighted 1/0.5/0.2; count and density per inhabitant; METODOLOGIA §25)
100 km radius (2026-11-12): 1,654 parks at 0–30 km, 697 at 30–60 km and 849 at 60–100 km (OSM, ohsome 2026-07-27); weighted 1/0.5/0.2 = 2,172 = 2,172; weighted population 4,444,645 (GHS-POP 2025) → 4.89 per 10k people. Regional score 8.25. Local score 8.00 (weight 60%) and regional 8.25 (weight 40%) → 8.10.
raw: Average of two mapping sources, OpenStreetMap and Overture Maps (Overture count ÷ K, K = median Overture/OSM ratio across the 39 cities: 2.57 within 2 km, 3.41 in the municipality); each source: 50% log1p(count within 2 km), 1000→10 + 50% log1p(per 10k pop.), 30→10. Brazil: 50% of that score + 50% log1p(CNPJ per 10k pop. ÷ K), 30→10 · since 2026-11-12: 60% this local score + 40% a regional score up to 100 km (rings 0–30/30–60/60–100 km weighted 1/0.5/0.2; count and density per inhabitant; METODOLOGIA §25)
100 km radius (2026-11-12): 3,947 restaurants at 0–30 km, 969 at 30–60 km and 1,542 at 60–100 km (OSM, ohsome 2026-07-27); weighted 1/0.5/0.2 = 4,740 = 4,740; weighted population 4,444,645 (GHS-POP 2025) → 10.66 per 10k people. Regional score 8.46. Local score 8.71 (weight 60%) and regional 8.46 (weight 40%) → 8.61.
raw: 117.6 destinations + venues weighted by distance (rings up to 100 km) · 50% log1p(weighted count), 110→10 + 50% log1p(per million people in the region, GHSL), 32.0→10; rings 0–30/30–60/60–100 km weighted 1/0.5/0.2 (since 2026-11-12; before: count within 50 km, 120→10)
100 km radius (2026-11-12): 77 destinations and venues at 0–30 km, 52 at 30–60 km and 73 at 60–100 km (OSM, ohsome 2026-07-27); weighted 1/0.5/0.2 = 118 = 118; weighted population 4,444,645 (GHS-POP 2025) → 26.46 per million people. Regional score 9.74.
raw: Average of two mapping sources, OpenStreetMap and Overture Maps (Overture count ÷ K, K = median Overture/OSM ratio across the 39 cities: 2.48 within 2 km, 3.20 in the municipality); each source: 50% log1p(count within 2 km), 500→10 + 50% log1p(per 10k pop.), 10→10. Brazil: 50% of that score + 50% log1p(CNPJ per 10k pop. ÷ K), 10→10 · since 2026-11-12: 60% this local score + 40% a regional score up to 100 km (rings 0–30/30–60/60–100 km weighted 1/0.5/0.2; count and density per inhabitant; METODOLOGIA §25)
100 km radius (2026-11-12): 833 bars at 0–30 km, 303 at 30–60 km and 528 at 60–100 km (OSM, ohsome 2026-07-27); weighted 1/0.5/0.2 = 1,090 × OSM completeness factor 1.32 (Overture in the municipality) = 1,445; weighted population 4,444,645 (GHS-POP 2025) → 3.25 per 10k people. Regional score 7.12. Local score 7.17 (weight 60%) and regional 7.12 (weight 40%) → 7.15.
raw: 300.0 count of OSM objects · log1p(count), 150→10 · since 2026-11-12: 60% this local score + 40% a regional score up to 100 km (rings 0–30/30–60/60–100 km weighted 1/0.5/0.2; count and density per inhabitant; METODOLOGIA §25)
100 km radius (2026-11-12): 475 cultural venues at 0–30 km, 174 at 30–60 km and 271 at 60–100 km (OSM, ohsome 2026-07-27); weighted 1/0.5/0.2 = 616 = 616; weighted population 4,444,645 (GHS-POP 2025) → 13.86 per 100k people. Regional score 10.00. Local score 10.00 (weight 60%) and regional 10.00 (weight 40%) → 10.00.
The city
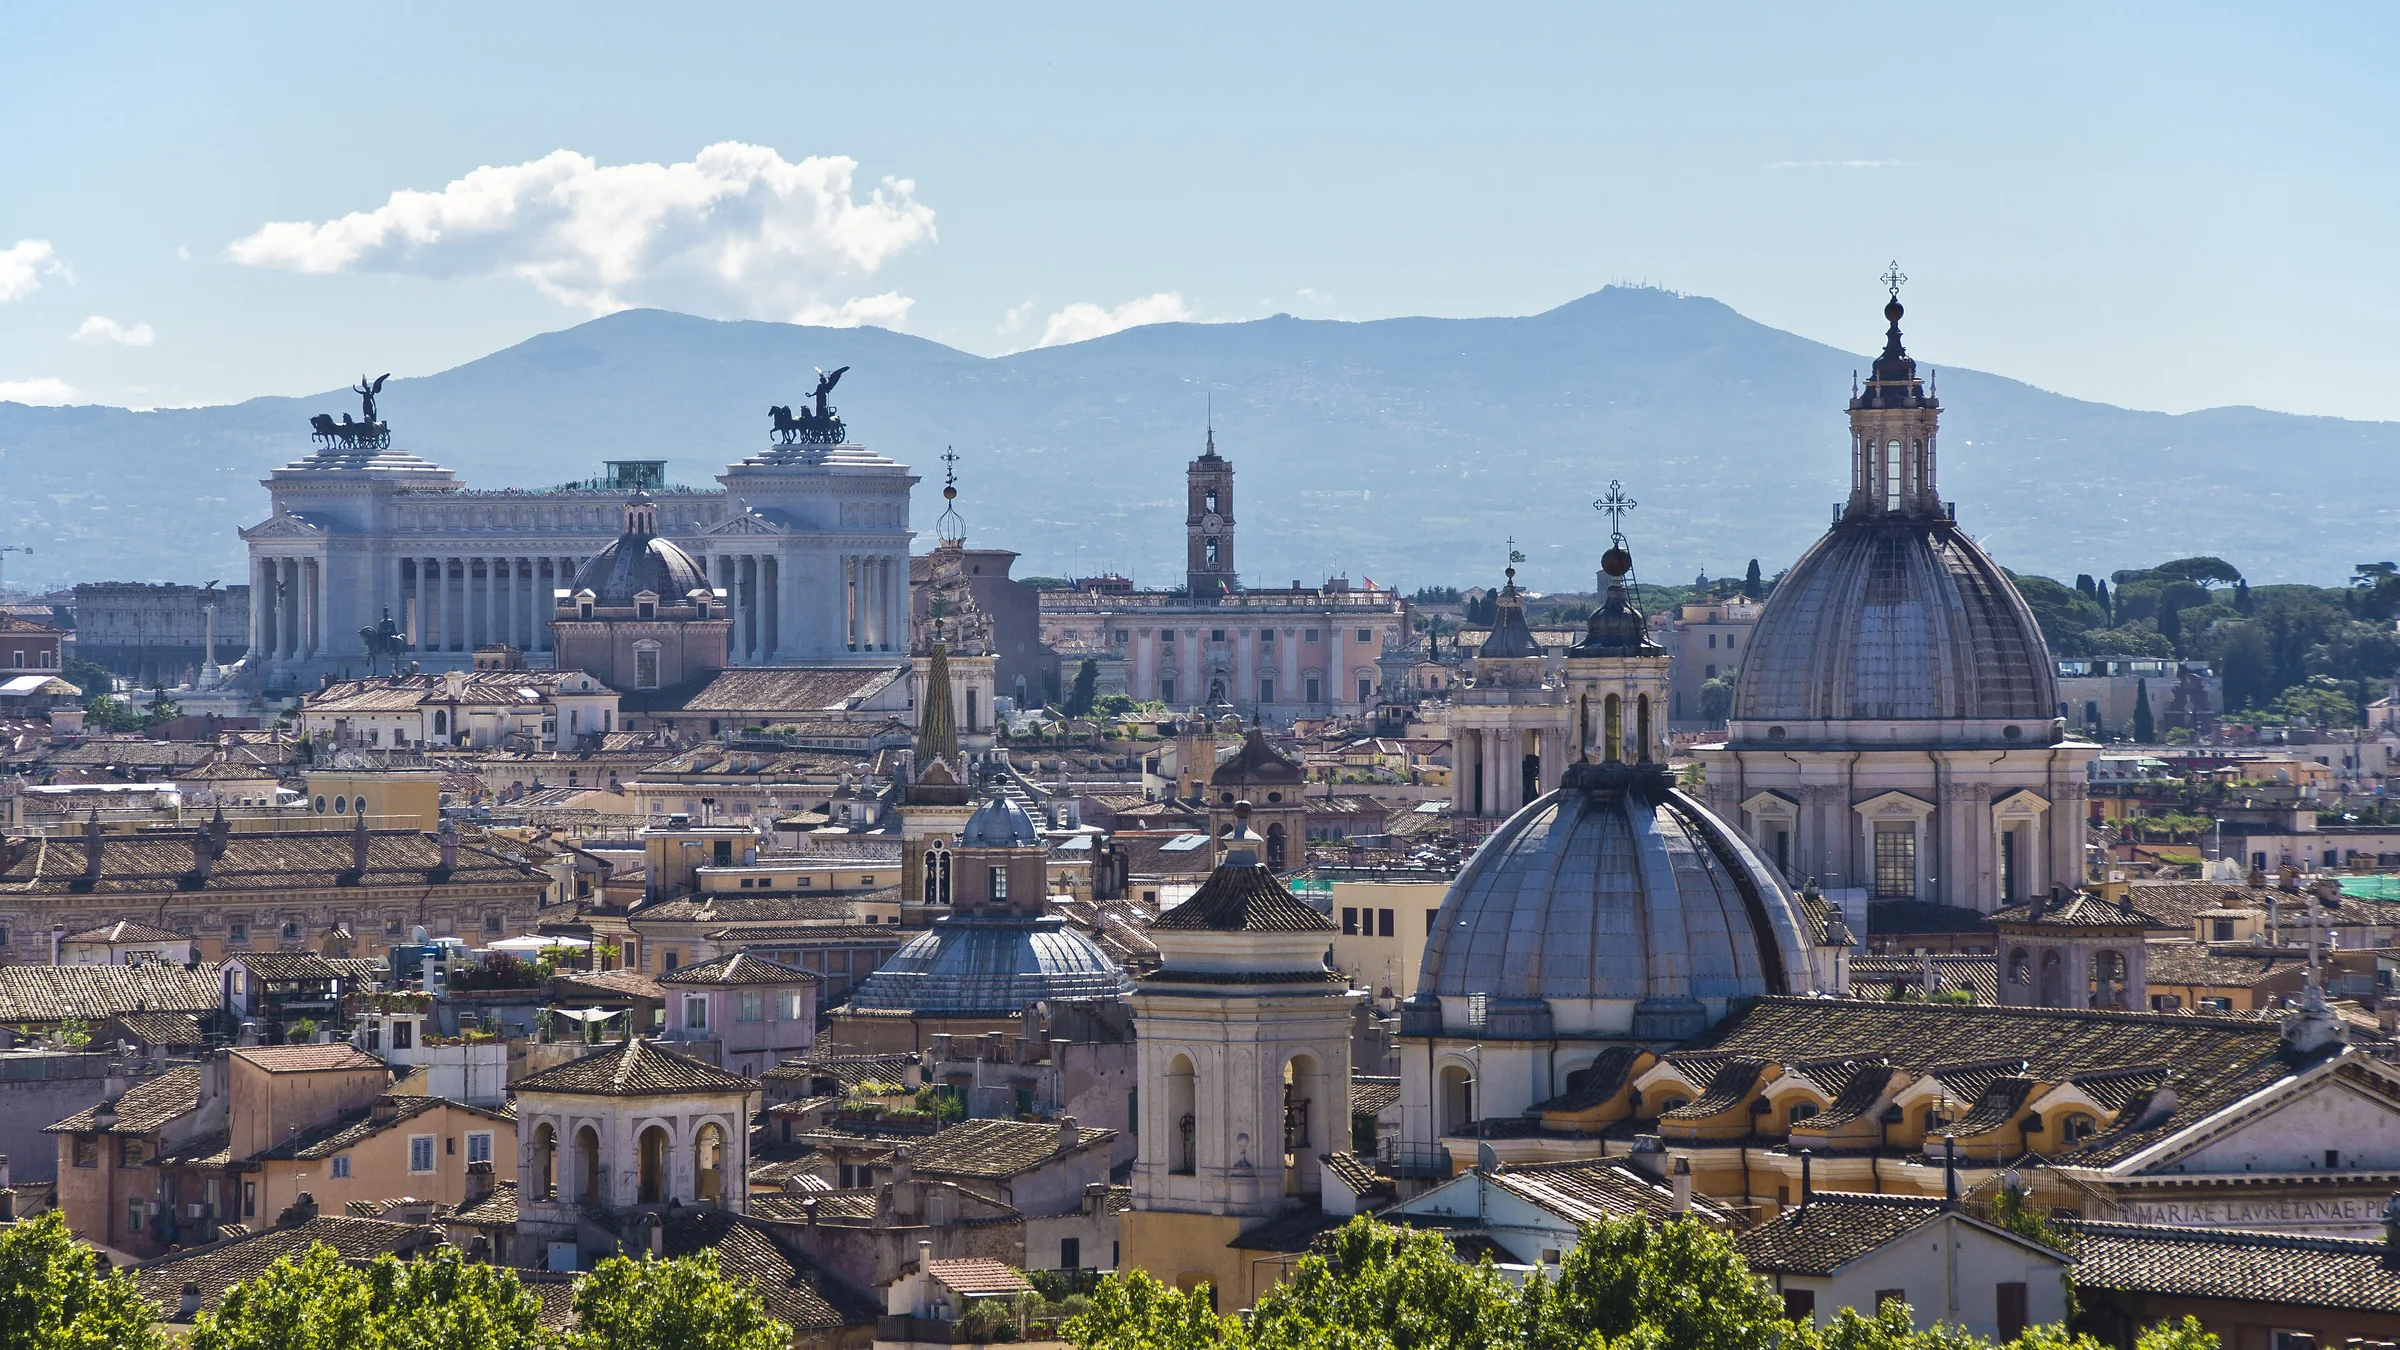
Rome is the capital of Italy and of the Lazio region, as well as the centre of the Metropolitan City of Rome and a special comune. With 2,860,009 residents in 1,285 km², Rome is the country's most populous comune and the third most populous city in the European Union. The Metropolitan City of Rome, with 4,355,725 inhabitants, is Italy's most populous metropolitan city, and its metropolitan area is the third most populous in the country. The city lies in the central-western part of the Italian Peninsula, along the banks of the Tiber. Vatican City is an independent country within Rome's boundaries, the only existing example of a country inside a city. Rome is often called the "City of Seven Hills" because of its geography, and the "Eternal City" because of its long history, having begun as a city and later become an empire. Rome is generally considered the "cradle of Western and Christian culture and civilization" and the centre of the Catholic Church.
English rendering of the Portuguese Wikipedia summary linked below. Source: wikipedia_pt. Wikipedia revision 73365785 (2026-11-04T16:23:20Z).
Taxation
Imposta di registro (registration tax): 9% (purchase from a private seller); 2% with the 'prima casa' benefit (min. €1,000); ipotecaria and catastale €50 each. Base: cadastral value (prezzo-valore) for individuals. Purchase from a developer: VAT 10% (4% prima casa) Agenzia delle Entrate
annual property tax (IBI/taxe foncière/ENFIA/IMU/固定資産税 etc.); no official local rate collected yet (we do not invent the figure). not collected in this round
Frequently asked questions
What is the Onde Viver Bem score for Rome?
Rome has an indicative score of 7.77/10 in the World ranking, updated November 18, 2026. Cost of living is not part of the score.
What are the strengths and weaknesses of the score for Rome?
The strongest published variables are Airport (10.00), Culture (10.00) and Beach / mountains (10.00); the weakest are Mild climate (3.70), Sun (5.48) and Safety (5.77).
Does cost of living or the land price per m² enter the score?
No. Cost of living and the land price per m² appear on the page but are not part of the score. See the methodology.
How is the score calculated?
It is an indicative 0–10 quality-of-life index, with 13 variables and published weights. Safety has a 15% weight and, when local data exist, a lethal-violence penalty may cap the total. The full method is on the methodology page.
Are any figures on this page estimates?
This page has no value marked as an estimate. Each metric cites its source.
Download the image and post it to your feed, story or video. To send people to the site, use the link sticker in your story or the link in your bio (links in captions are not clickable).
Informational content and indicative scores. This is not advice on investing, immigration, buying property or choosing a career. Every metric cites its source; cost of living is not part of the score.