Best cities to live in France
Onde Viver Bem rates 12 cities in France in this update. The highest score belongs to Nice (7.68, #40 of 175 in the global ranking); the lowest to Lille (6.77, #117 of 175).
Criteria where cities in France sit furthest above the median of the database: Bars (7.00 vs 5.11); Health (8.63 vs 7.01); Culture (9.40 vs 7.82). Furthest below: Sun (3.40 vs 7.04); Mild climate (3.67 vs 5.78).
Scores from 0 to 10 per criterion; median of the cities in the country vs the median of all 175 cities. Each number's detail and source are on each city page.
Score × land price per m²
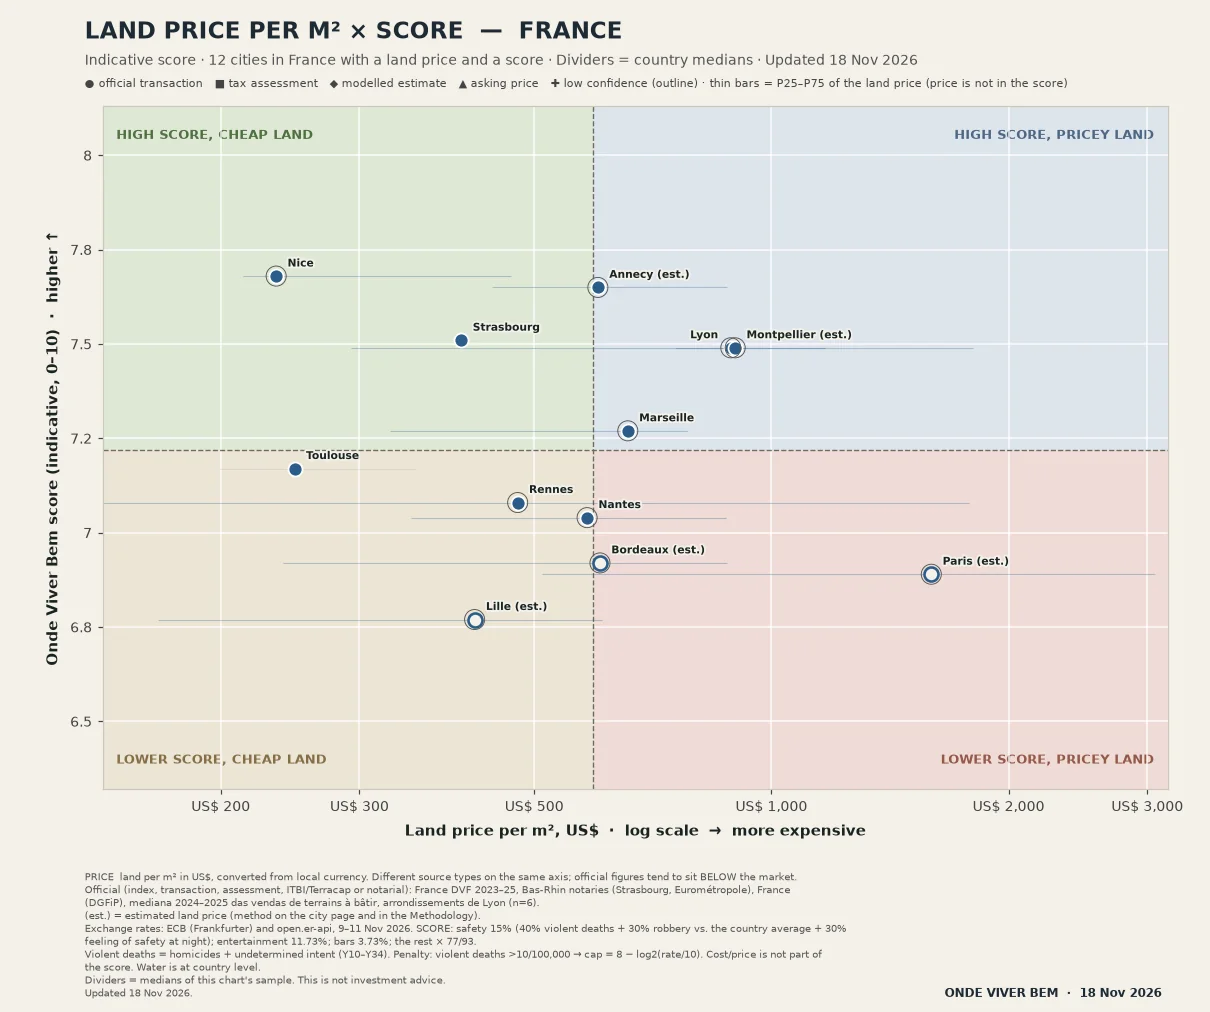
● official transaction ■ tax assessment ◆ modelled estimate ▲ asking price ✚ low confidence (outline) · thin bars = P25–P75 of the land price (price is not in the score). On phones, the narrow version of the chart leaves out the P25–P75 bars and labels only highlights and extremes; the full list of points is below.
Chart sources and notes
PRICE land per m² in US$, converted from local currency. Different source types on the same axis; official figures tend to sit BELOW the market.
Official (index, transaction, assessment, ITBI/Terracap or notarial): France DVF 2023–25, Bas-Rhin notaries (Strasbourg, Eurométropole), France (DGFiP), mediana 2024–2025 das vendas de terrains à bâtir, arrondissements de Lyon (n=6).
(est.) = estimated land price (method on the city page and in the Methodology).
Exchange rates: ECB (Frankfurter) and open.er-api, 9–11 Nov 2026. SCORE: safety 15% (40% violent deaths + 30% robbery vs. the country average + 30% feeling of safety at night); entertainment 11.73%; bars 3.73%; the rest × 77/93.
Violent deaths = homicides + undetermined intent (Y10–Y34). Penalty: violent deaths >10/100,000 → cap = 8 − log2(rate/10). Cost/price is not part of the score. Water is at country level.
Dividers = medians of this chart's sample. This is not investment advice.
Updated 18 Nov 2026.
All 12 points, highest score first
- Nice score 7.68 · US$ 235/m²
- Annecy score 7.65 · US$ 602/m² (est.)
- Strasbourg score 7.51 · US$ 404/m²
- Lyon score 7.49 · US$ 888/m²
- Montpellier score 7.49 · US$ 899/m² (est.)
- Marseille score 7.27 · US$ 657/m²
- Toulouse score 7.17 · US$ 248/m²
- Rennes score 7.08 · US$ 476/m²
- Nantes score 7.04 · US$ 583/m²
- Bordeaux score 6.92 · US$ 606/m² (est.)
- Paris score 6.89 · US$ 1,596/m² (est.)
- Lille score 6.77 · US$ 420/m² (est.)
Explore by country
Most cities: Brazil Spain United States France Australia See all 42 countries
Cities in the ranking
“#” is the rank among the cities in the country; “Global” is the position in the global ranking (175 cities). Scores are indicative.
| # Rank within country | City | Score | Global | Land price per m² |
|---|---|---|---|---|
| 1 | Nice See the dataGlobal 40/175 | 7.68 * | 40/175 | US$ 235/m² * |
| 2 | Annecy See the dataGlobal 44/175 | 7.65 * | 44/175 | US$ 602/m² * |
| 3 | Strasbourg See the dataGlobal 49/175 | 7.51 * | 49/175 | US$ 404/m² * |
| 4 | Lyon See the dataGlobal 53/175 | 7.49 * | 53/175 | US$ 888/m² * |
| 5 | Montpellier See the dataGlobal 54/175 | 7.49 * | 54/175 | US$ 899/m² * |
| 6 | Marseille See the dataGlobal 69/175 | 7.27 * | 69/175 | US$ 657/m² * |
| 7 | Toulouse See the dataGlobal 83/175 | 7.17 * | 83/175 | US$ 248/m² * |
| 8 | Rennes See the dataGlobal 88/175 | 7.08 * | 88/175 | US$ 476/m² * |
| 9 | Nantes See the dataGlobal 97/175 | 7.04 * | 97/175 | US$ 583/m² * |
| 10 | Bordeaux See the dataGlobal 106/175 | 6.92 * | 106/175 | US$ 606/m² * |
| 11 | Paris See the dataGlobal 110/175 | 6.89 * | 110/175 | US$ 1,596/m² * |
| 12 | Lille See the dataGlobal 117/175 | 6.77 * | 117/175 | US$ 420/m² * |
Data-quality note. Hover the icon (or use a screen reader) to read the summary; the range, the source and the details are on each city's page.
Coverage and limits
The list does not cover every city in France: it includes only those the database rates in this update (November 18, 2026), with the same rule for all 175 cities. Scores are editorial and indicative, cost of living is not part of the score, and the land price per m² is shown only for comparison. Read the methodology.
Keep exploring
Share this page
Card for Instagram and TikTok
Download the image and post it to your feed, story or video. To send people to the site, use the link sticker in your story or the link in your bio (links in captions are not clickable).
Download card (PNG 1080×1350)